Search the Omeda Knowledge Base
Reports – Web Behavior Reporting
Accessing the reports via the Omeda portal
To access the reports:
- Login to http://my.omeda.com
- Select the Menu tab in the top right, then Reports and Analytics under the Manage section.
- There is a section called Web Behavior Reports. Select the report that you want to run.
- If requested, log in to the reports server using your normal Omeda credentials.
User Interface

- Client – this will be auto populated with your organization.
- Brand – this is the brand that you wish to run the report on and is a required field.
- Visit Start Date – combined with Visit End Date allows you to select a date range for which to run your report. Click on the date picker icon to change the value. Requires either Internet Explorer or Firefox.
- Olytics Behavior – Behavior is normally associated to a unique site domain visit. This is an optional field that allows you to specify only certain Behaviors (sites) to run your report against.
- Olytics Fields – These are the meta data types, buckets if you will, that Olytics captures and from your sites. For example Category, Tag, Item Topic etc.
- Search Tag – Once you specify an Olytics Field, you can search for specific values that are stored under that specific Field Type.
- Olytics Tag– Is another option once you selected a Olytics Field. This option is a multi-select drop down that allows you to select multiple values stored under a specific Field Type to run a report against. If no values are selected, the report will default to the top 20 found.Avoid using the ‘Select All’ option if you have a large number of values.
- OnQ Query – This option allow you to run the report on a saved query. For example, the query selects the decision makers with Olytics behavior data from one of your sites. Combine that with a breakout of Olytics Category, Tags, Topic and a Date Range.
- View Report – button to generate the report based on your selections. Depending on the data set you are running the report on, the report may take some time to render.
- Important Note:If no tag is selected, the report will default to the top 20 tags given your other selections. The same is true for categories.
Navigating A Generated Report
Depending on the size of the report you run, you will use the navigation arrows to browse the pages of your report:

Exporting A Report
The reports can be exported to:
- Word (.doc)
- Excel
Select the format you which to export and click the ‘Export’ link.

Viewing and Outputting customer specific data
- All of the counts shown in the Web Behavior reports are select-able.
- Clicking on a count will take you to a page with specific customer information per visitor, such as name, email, address, and IP related fields when available.
- You can then opt to output that information excel.
Reports
The following reports are available to Olytics users. If you cannot find a report that you would like to access, you can request access via the Customer Support Portal.
Olytics – General Traffic Report
Shows various trends based on the user selections of dates, behaviors, category and/or tags:
- Total Visit Count based on user selections (Anonymous and/or Known)
- Total Unique Customers based on user selections (Anonymous and/or Known)
- A graph of Total / Known / Anonymous visits over time
- Graphs of the traffic over time per tag / category
The report is composed of the following sections:
- Summary
- The summary section simply displays the options that were selected in running the report.
- Aggregate Counts
- Total Visit Count
- Known Visit Count
- Anonymous Visit Count
- Total Distinct Customer Count
- Known Customer Count
- Anonymous Customer Count
- Graph of visits over time based on UI selections.
- Graph of unique customer visits over time based on UI selections.
- Total Visit Count
- Top OlyticsTags – Graphs
- Graph of total visits over time broken down by tag.
- Graph of anonymous visits over time broken down by tag.
- Graph of anonymous visits over time broken down by tag.
- Top Olytics Tag (Counts)
- Total visit Count per tag
- Anonymous visit Count per tag
- Known visit Count per tag
- Option to view a graph for a specific tag
- Top Olytics Categories – Graphs
- Graph of total visits over time broken down by category.
- Graph of anonymous visits over time broken down by category.
- Graph of anonymous visits over time broken down by category.
- Top Olytics Categories(Counts)
- Total visit Count per category
- Anonymous visit Count per category
- Known visit Count per category
- Option to view a graph for a specific category
Olytics – Pathing Report
Shows how the customers arrived at the site for the given user selections of dates, behaviors, category and/or tags
- Shows the top 50-100 referring domains for the users selections, each with a combined, anonymous, and known visit count
- Total Visit Count based on user selections (Anonymous and/or Known)
- Total Unique Customers based on user selections (Anonymous and/or Known)
The report is composed of the following sections:
- Summary
- The summary section simply displays the options that were selected in running the report.
- Aggregate Counts
- Total Visit Count
- Known Visit Count
- Anonymous Visit Count
- Total Distinct Customer Count
- Known Customer Count
- Anonymous Customer Count
- Graph of visits over time of referring domains based on UI selections.
- Graph of unique customer visits over time of referring domains based on UI selections
- Total Visit Count
- Top Visits By Referring Domain (Counts)
- Total visit count for each referring domain.
- Anonymous visit count for each referring domain.
- Known visit count for each referring domain.
- Option to view a graph for a specific referring domain.
Olytics – Visitor Technology Report
Shows counts for the most popular device types, operating systems, and browsers that your visitors used to access your site for the given user selections of dates, behaviors, category and/or tags.
- Total Visit Count based on user selections (Anonymous and/or Known)
- Total Unique Customers based on user selections (Anonymous and/or Known)
- Accompanying graphs that show the visitors technology over time
The report is composed of the following sections:
- Summary
- The summary section simply displays the options that were selected in running the report.
- Aggregate Counts
- Total Visit Count
- Known Visit Count
- Anonymous Visit Count
- Total Distinct Customer Count
- Known Customer Count
- Anonymous Customer Count
- Total Visit Count
- Browser Graphs
- Graph of total visits over time by browser based on UI selections.
- Graph of anonymous customer visits over time by browser based on UI selections
- Graph of known customer visits over time by browser based on UI selections
- Top Visits By Browser (Counts)
- Total visit count for each browser.
- Anonymous visit count for each browser.
- Known visit count for each browser.
- Option to view a graph for a specific browser.
- Operating System Graphs
- Graph of total visits over time by operating system based on UI selections.
- Graph of anonymous customer visits over time by operating system based on UI selections
- Graph of known customer visits over time by operating system based on UI selections
- Top Visits By Operating System (Counts)
- Total visit count for each operating system.
- Anonymous visit count for each operating system.
- Known visit count for each operating system.
- Option to view a graph for a specific operating system.
- Device Graphs
- Graph of total visits over time by device based on UI selections.
- Graph of anonymous customer visits over time by device based on UI selections
- Graph of known customer visits over time by device based on UI selections
- Top Visits By Device (Counts)
- Total visit count for each device.
- Anonymous visit count for each device.
- Known visit count for each device.
- Option to view a graph for a specific device.
Olytics Field Count
User Interface: Many of the options are the same as the other Web Behavior reports – Here are the differences.

- Search Tag: Not an option on this report because this report runs counts on every value for the select Olytics Field.
- Olytics Tag: Not an option on this report because this report runs counts on every value for the select Olytics Field.
- Olytics Fields**: On these reports there is an option to select ALL Olytics Fields or a single Olytics Field for the report.
- Limit Results to Top: Many clients have thousands of values associated to each Olytics Field. This will limit the report to top (50,100, 200) specified results for each Olytics Field selected for the report.
** Note, if you are not passing categories and/or tags back to the database, selecting ALL will allow you to still run the report to see the most-visited pages on your site.
Olytics – Field Count
Shows counts on each value for the specified Olytics Field selected. Each value has Visit Count, Known Customer Count and Anonymous Customer Count and can be opened in excel with basic customer information.
Page (1) of the report provides counts for each Olytics Field values based on the user selections of dates, behaviors:
Page (2) when option ALL Olytics Fields is selected, then page (2) is a breakdown by Olytics Field and value.
Page (3) when option ALL Olytics Fields is selected, then this report is page (3). Otherwise, it is page (2). The report shows a breakdown by Behavior Site, Olytics Field and Value.
- Aggregate Counts
- Total Visit Count
- Known Customer Count
- Anonymous Customer Count
- Total Visit Count
Olytics – Field Count by URL
Shows counts on each value for specified Olytics Field select by URL. Each value has Visit Count, Known Customer Count and Anonymous Customer Count and each count can be opened in excel with basic customer information.
Page (1) of the report shows counts by behavior name (site), Olytics Field, Value and URL.
- Aggregate Counts
- Total Visit Count
- Known Customer Count
- Anonymous Customer Count
- Total Visit Count
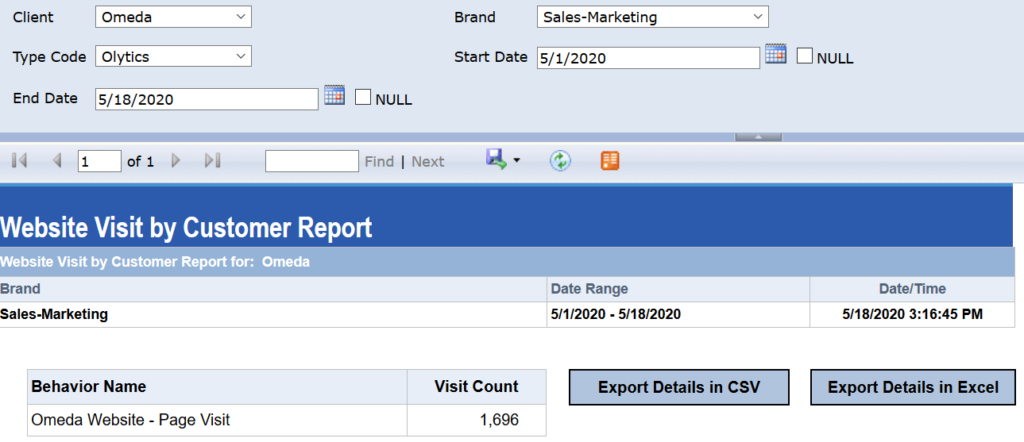
Olytics – Website Visit by Customer
This report will let you run Known visit counts by website based on a time frame you select. There is also an option to export the data to excel, which will give you those Known customer visit details. The details include: Behavior Name, Customer ID, Created Date, Title, Email Address, Company Name, Visit Date, Visit Counts per Day, All Visits History.
Behavior Analysis Report
The Behavior Analysis Report provides both a summary and in-depth view into behaviors that is not obtainable in Audience Builder. The report will allow you to answer questions like:
- How many customers are associated to a specific behavior in a given timeframe, broken out by behavior attributes. For example, how many customers registered for a webinar in the past 3 months, and which webinars did they register for?
- How many specific behaviors did we register in a given timeframe? For example, how many webinar registrations did we record in the past 3 months. Where Audience Builder will return a unique customer count for the number of customers who registered for at least 1 webinar in the past 3 months, the Behavior Analysis Report will provide you with a count of registrants, where a single customer might be counted multiple times if said customer registered for multiple webinars within the profiled timeframe.
- How many customers engaged in a behavior in a given timeframe. For example, how many customers attended a webinar in the past month, and which webinars.
A couple enhancements to the Behavior Analysis Report include adding a demographic to the report output and running the report on an Audience Builder query.
To run the Behavior Analysis Report, start by selecting a date range:

The remaining Behavior filters mirror the Behavior (Advance) filters in Audience Builder. First, select Behavior Product(s) to be included in the report. This first selection will start isolating your data set. As you waterfall through the Behavior Product, Action, Behavior Individual Product and Tag filters the selection options will be narrowed down to just the applicable data points related to the previous selection. For example, once Behavior Product(s) are selected, the Actions are limited to only actions associated to Behavior Product(s) selected; once Action(s) are selected, the Behavior Individual Product(s) selection is limited to values associated to Behavior Product(s)+Action(s) selected, etc. Then click View Report.
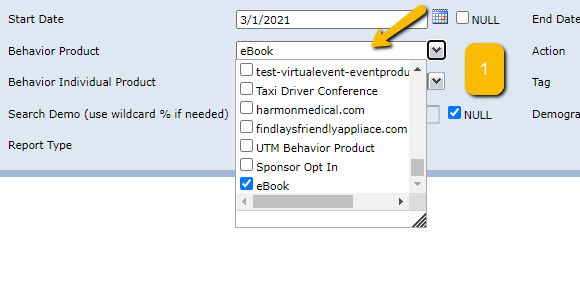
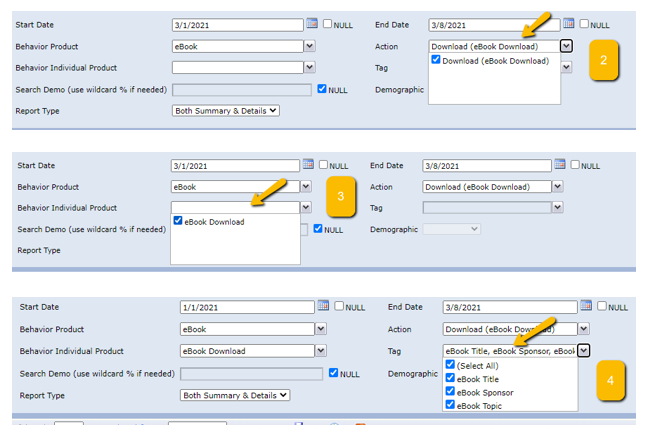
These filters mirror the Behavior Search (Advanced) filters in Audience Builder:
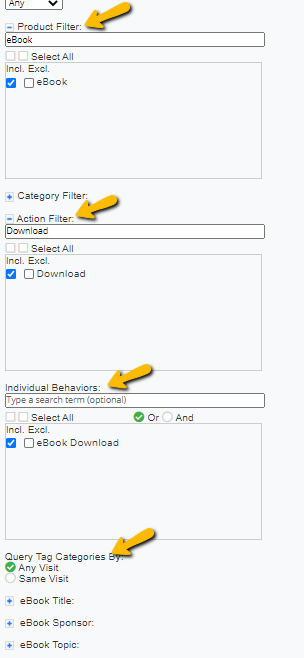
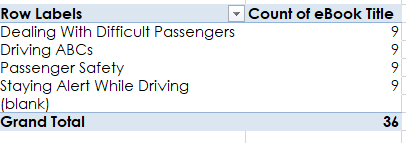
The report will provide both a Summary and Detail. The Summary shows a breakdown of Behavior by behavior count and customer count. For example, below we see there were 36 eBook downloads in the profiled timeframe, and 9 unique customers account for the 36 downloads.

If we look at the Detail report, we see unique customers can appear in multiple rows.
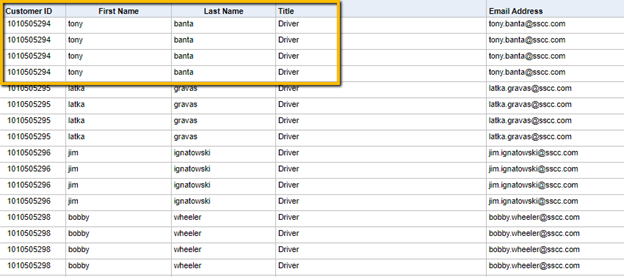
One row for each eBook the customer downloaded. Note, all attributes tied to each behavior action are joined in the report rows.

Adding A Demographic To The Report
A demographic can also be added to the report output. First filter the demographics using the Search Demo field. A demographic search is required to bring up a list of matching demographic fields in the Demographic dropdown. Please use % as wildcards in the Search Demo field.

The selected demographic will appear as a column in the report output.

Running Report on an Audience Builder Query:
The report can be run on a specific query segment by selecting a query in the OnQ Query Filter dropdown menu. Setting this filter to (Null) will run the report across the entire database.

Please note if the date range in the query and the date range in the report filter are not inline the report might return a different count than the query.
Exporting
From here, the report can be downloaded as an Excel spreadsheet where filters, pivot tables and reports can be used to generate additional insights. Use the Save icon to download the report.
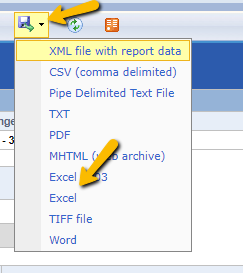
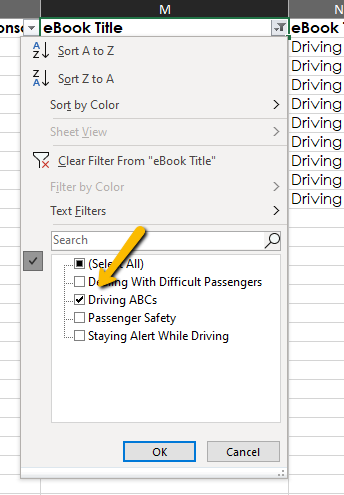
In Excel you can use Filters:
Pivots:
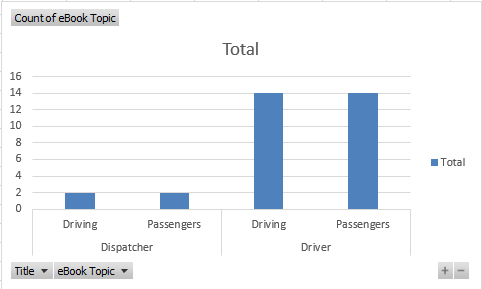
Pivot Charts:
Personalization Summary Report
User Interface
- Client – this will be auto populated with your organization.
- Brand – this is the brand that you wish to run the report on.
- Start Date – combined with End Date allows you to select a date range for which to run your report. Click on the date picker icon to change the value.
- End Date – combined with Start Date allows you to select a date range for which to run your report. Click on the date picker icon to change the value.
- Enter Job Name to Narrow Search – this will target a specific job or can be used as a keyword search (i.e., “renewal, newsletter, registration”). You can also use a wild card of % (i.e., %new%, %letter, and re%).
- Limit on detail views/clicks – It limits the number of impressions and clicks pane. For example, if the filter is set to one, the click detail will show the date of the first click, then note the number of additional clicks. If you change the count in the filter (e.g., from 10 to 1).
*Null will search for every available date or character depending upon the search box you are using.
Summary:
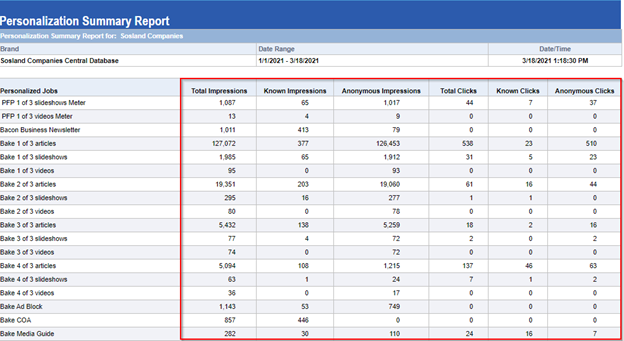
This report shows the Total number of Impressions and Clicks for Known and Anonymous Traffic for individual personalizations.
The report is composed of the following sections:
Personalized Jobs – The name of the personalizations from your search string
Total Impressions – This is the gross count of all impressions for a specific personalization. Or at the very bottom the total of all the personalization impressions for your search string.
Known Impressions – This is the unique count of all known records (known+behaviors) impressions for a specific personalization. Or at the very bottom the total of all the known (known+behaviors) personalization impressions for your search string.
Anonymous Impressions– This is the unique count of all Anonymous records impressions for a specific personalization. Or at the very bottom the total of all the anonymous personalization impressions for your search string.
Total Clicks – This is the gross count of all clicks for a specific personalization. Or at the very bottom the total of all the personalization clicks for your search string.
Known Clicks – This is the unique count of all known records (known+behaviors) clicks for a specific personalization. Or at the very bottom the total of all the known (known+behaviors) personalization clicks for your search string.
Anonymous Clicks – This is the unique count of all Anonymous records clicks for a specific personalization. Or at the very bottom the total of all the anonymous personalization clicks for your search string.
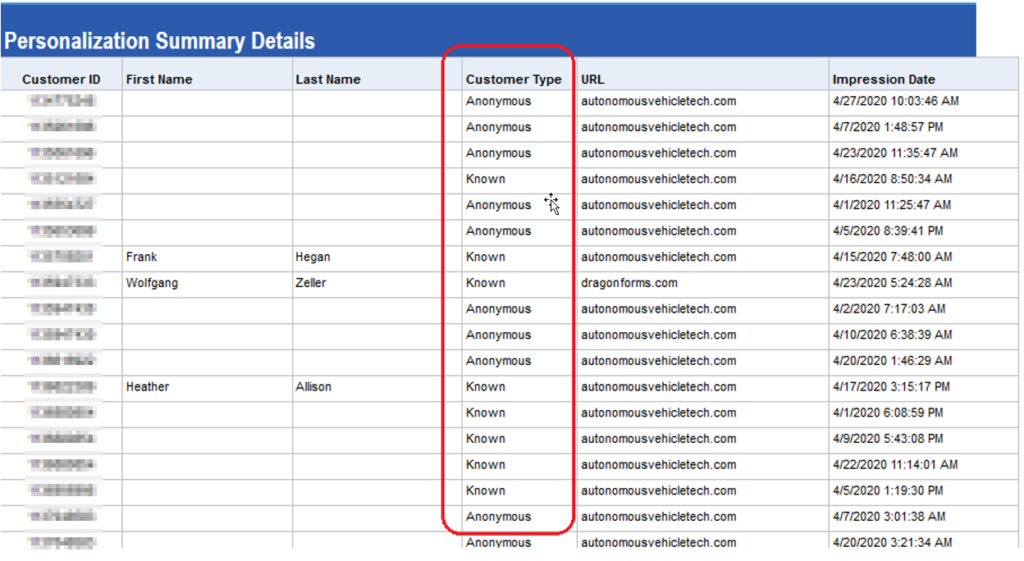
This report also has a detailed view. When you click on any of the numbers that are not zero in this report it takes you to the detailed view. Please see the screenshot to review the area in which you can select the numbers
Once you have selected a number you should be taken to the following detail report (all Customer ID’s have been blacked out):

As you can see from the screen shot the detail from an impression selection. If a user has more impressions that what you accounted for in the Limit on detail views/clicks section it will appear as it does in column J label Impressions 6. See below for a view of the click report.
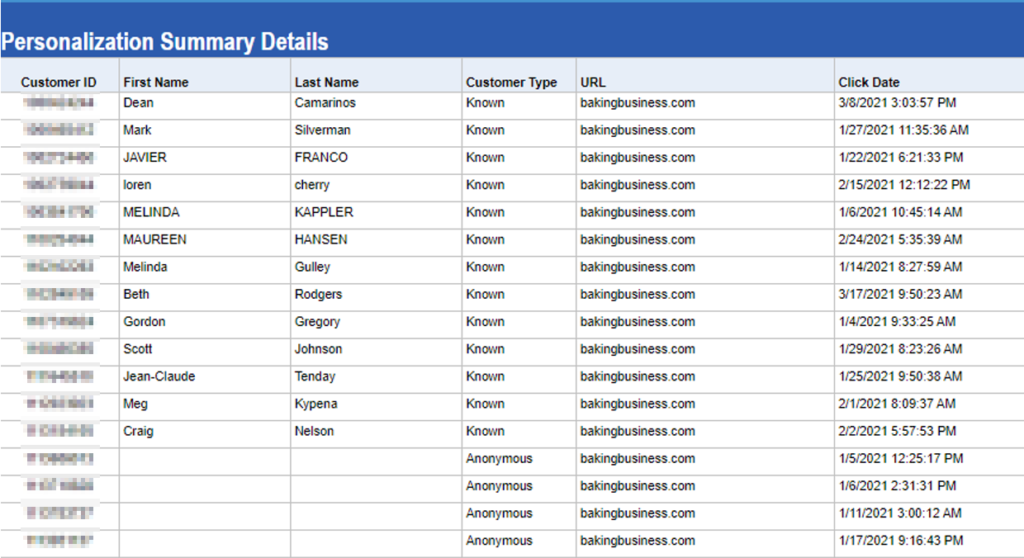
Please note that both reports contain a Customer Type section that let’s you know that if the impression or the click was a known or anonymous user.
