Search the Omeda Knowledge Base
-
The Omeda Experience
-
Documentation
-
-
- Brand Comprehensive Lookup Service
- Brand Promotions Quantity
- Brand Group Lookup
- Brand Promotions Content By Promo Code
- Brand Promotions By Promo Code
- Behavior Categories Lookup
- Behavior Actions Lookup
- Behavior Lookup Grouped By Product
- Behavior Lookup By Id
- Behavior Lookup
- Demographic Lookup by Brand API
- Deployment Type Lookup by Brand API
- Product Lookup by Brand API
-
- Customer Lookup By Email Address
- Subscription Lookup By Customer Id
- Order History Lookup by Customer Id
- Customer Lookup by Hashed Email Address
- Email Address Lookup By Customer Id
- Gift Lookup by Donor ID
- Behavior Lookup By Customer Id
- Subscription Lookup By Email
- Customer Merge History Lookup
- Customer Lookup By Name and Country
- External ID Lookup By Customer Id
- Demographic Lookup By Customer Id
- Phone Lookup By Customer Id
- Postal Address Lookup By Customer Id
- Customer Change Lookup
- Customer Comprehensive Lookup By Customer Id
- Customer Lookup By EncryptedCustomerId
- Customer Lookup By External ID
- Customer Lookup By PostalAddressId
- Customer Lookup By Customer Id
- Email Validity Lookup API
- Behavior Attribute Lookup by Customer Id
- Order Issue History Lookup by Customer Id
- Show all articles (8) Collapse Articles
-
- Email On Demand Send
- Email Deployment
- Email Deployment Clone
- Email Deployment Remove Audience
- Email Audience Assignment Status
- Email Deployment Content
- Email Deployment Approval Lookup
- Email Deployment Schedule
- Email Deployment Cancel
- Email Deployment Search
- Email Flag Email As Invalid
- Email Clicks
- Email - Checklist for Sends Created via API Calls
- Email Deployment Content Lookup
- Email Deployment Unschedule
- Email Deployment Lookup
- Email Deployment Test
- Email Deployment Add Audience
- Email Opt In/Out Lookup
- Email Optout Queue
- Email Optin Queue
- Email Deployment Audience List FTP
- Show all articles (7) Collapse Articles
-
-
- Release Notes for Feb. 2 | V24.2
- Release Notes for Feb. 23 | V24.3
- Release Notes for Mar. 15 | V24.4
- Release Notes for Apr. 5 | V24.5
- Release Notes for Apr. 26 | V24.6
- Release Notes for May 24 | V24.7
- Release Notes for June 7 | V24.8
- Release Notes for June 28 | V24.9
- Release Notes for July 19 | V24.10
- Release Notes for Aug. 9 | V24.11
-
- Release Notes for Jan 27 | V23.2
- Release Notes for Feb 17 | V23.3
- Release Notes for Mar 10 | V23.4
- Release Notes for Mar 31 | V23.5
- Release Notes for Apr 21 | V23.6
- Release Notes for May 19 | V23.7
- Release Notes for June 2 | V23.8
- Release Notes for June 23 | V23.9
- Release Notes for July 14 | V23.10
- Release Notes for Aug 4 | V23.11
- Release Notes for Aug 25 | V23.12
- Release Notes for Sep 15 | V23.13
- Release Notes for Oct 6 | V23.14
- Release Notes for Oct 27 | V23.15
- Release Notes for Nov 16 | V23.16
- Release Notes for V23.17
- Show all articles (1) Collapse Articles
-
- Release Notes for Jan 14 | V22.1
- Release Notes for Feb 4 | V22.2
- Release Notes for Feb 25 | V22.3
- Release Notes for Mar 18 | V22.4
- Release Notes for Apr 8 | V22.5
- Release Notes for Apr 29 | V22.6
- Release Notes for May 20 | V22.7
- Release Notes for June 10 | V22.8
- Release Notes for July 1 | V22.9
- Release Notes for July 22 | V22.10
- Release notes for Aug 12 | V22.11
- Release Notes for Sep 2 | V22.12
- Release Notes for Sep 23 | V22.13
- Release Notes for Oct 14 | V22.14
- Release Notes for Nov 4 | V22.15
- Release Notes for Dec 2 | V22.16
- Show all articles (1) Collapse Articles
-
- Release Notes for V21.1
- Release Notes for V21.2
- Release Notes for V21.3
- Release Notes for V21.4
- Release Notes for V21.5
- Release Notes for V21.6
- Release Notes for V21.7
- Release Notes for V21.8
- Release Notes for V21.9
- Release Notes for V21.10
- Release Notes for V21.11
- Release Notes for V21.12
- Release Notes for V21.13
- Release Notes for V21.14
- Release Notes for V21.15
- Release Notes for V21.16
- Release Notes for V21.17
- Show all articles (2) Collapse Articles
-
- Release Notes for V20.1
- Release Notes for V20.2
- Release Notes for V20.3
- Release Notes for V20.4
- Release Notes for V20.5
- Release Notes for V20.6
- Release Notes for V20.7
- Release Notes for V20.8
- Release Notes for V20.9
- Release Notes for V20.10
- Release Notes for V20.11
- Release Notes for V20.12
- Release Notes for V20.13
- Release Notes for V20.14
- Release Notes for V20.15
- Release Notes for V20.16
- Release Notes for V20.17
- Show all articles (2) Collapse Articles
-
- Release Notes for V19.1
- Release Notes for V19.2
- Release Notes for V19.3
- Release Notes for V19.4
- Release Notes for V19.5
- Release Notes for V19.6
- Release Notes for V19.7
- Release Notes for V19.8
- Release Notes for V19.9
- Release Notes for V19.10
- Release Notes for V19.11
- Release Notes for V19.12
- Release Notes for V19.13
- Release Notes for V19.14
- Release Notes for V19.15
- Release Notes for V19.16
- Release Notes for V19.17
- Show all articles (2) Collapse Articles
-
-
-
CDP – Customer Data Platform
-
-
- Personalization Overview
- Personalization - FAQs
- Personalization - Reporting
- Personalization - Archiving & Restoring
- Personalization - HTML Templates
- Personalization - Scroll Trigger and Infinite Scroll Pages
- Personalization - Merge Variables
- Personalization - 'Generate Personalization' Option
- Personalization & Metering - Click Tracking
- GDPR Consent Management
- Personalization - A/B Testing
-
-
Integrations
-
-
- Integration with Zapier
- Bring Customer Data in via Webhooks by Zapier Action - POST Event
- Bring Customer Data in using Zapier
- Omeda's Add Customer Action in Zapier
- Send Form Submission Data via Zapier
- Bring Customer Data in via Webhooks by Zapier Action – Custom Request Event
- Formatter by Zapier Action
-
-
-
Analytics & Reporting
-
- Odyssey - Reporting
- Personalization - Reporting
- Reports - Email Device and Client Type Reporting
- Email - Clickbot Reporting
- Reports - Email Reporting
- Metering - Reporting
- Reports - Audience Overlap Report
- Reports - Engaged Companies Report
- Reports-AutoRenewals Analysis Report
- Reports - Audience Report
- Reports - Issue Activity Reporting
- Reports - Overview
- Reports - Web Behavior Reporting
- Reports- FAQs
- Reports - Data Tracker Reporting
- Reports - Audience Builder Reporting
- Form Submit Report
- Behavior Promo Code Report
- Reporting Library
- Show all articles (4) Collapse Articles
-
Marketing Automation & Email Builder
-
-
- Email On Demand Send
- Email Deployment
- Email Deployment Clone
- Email Deployment Remove Audience
- Email Audience Assignment Status
- Email Deployment Content
- Email Deployment Approval Lookup
- Email Deployment Schedule
- Email Deployment Cancel
- Email Deployment Search
- Email Flag Email As Invalid
- Email Clicks
- Email - Checklist for Sends Created via API Calls
- Email Deployment Lookup
- Email Deployment Test
- Email Deployment Add Audience
- Email Opt In/Out Lookup
- Email Optout Queue
- Email Optin Queue
- Email Deployment Audience List FTP
- Show all articles (5) Collapse Articles
- Email Builder - User Guide
- Email - Clickbot Reporting
- Reports - Email Reporting
- Email - Link Tracking Errors
- Email - Deployment Defaults
- Omeda - Getting Support
- Email - Checklist for Sends Created via API Calls
- Email - Assigning Link Tracking Categories
- Email - Deliverability
- Email - Opt-Out Footer Merge Variable
- Email - Stealth Link
- Email - Behavioral Data
- Email - Automation for Email Sending
- Email - Deployment Type Creation
- Email – Training Schedules for New Clients
- Email - Request a New Deployment Type
- Email - Adding Domains to Safe Sender List
- Email - Deployment Checklist & Best Practices
- Email Deployment Unschedule
- Email Builder - Getting Started
- Campaign Tool - Overview
- Email - Automated ACS Notifications
- Email - Dynamic Content
- Email - Recurring Deployments
- Email - FAQs
- Email - Web Tracking
- Email - Validation Services
- Email Services - Overview & Capabilities
- Email - Web Tracking String Parameter Definitions
- Email - Appending Lists On Triggered Deployments
- Email - Preference Page
- Email - A/B Testing
- Email - Triggered Deployments
- Email - Merge Variables
- Email - User Set-up
- Email - Advanced Features
- Email - Glossary
- Email – Checklist for New Clients
- Show all articles (23) Collapse Articles
-
-
-
- Odyssey - Audience Element
- Odyssey - Timing Elements
- Odyssey - Adroll Elements
- Odyssey - Facebook Elements
- Odyssey - Filter Element
- Odyssey - Form Submit Element
- Odyssey - Pathfinder Element
- Odyssey - Export Element
- Odyssey - Split Element
- Odyssey - Personalization Element
- Odyssey - Metering Element
- Odyssey - Email Element
- Odyssey - Goal Element
- Odyssey - A/B Test Element
- Odyssey - Google Ad Manager Element
- Odyssey Fatigue Filter Element
- Show all articles (1) Collapse Articles
- Odyssey Overview
- Odyssey - FAQs
- Odyssey - Editing an In Progress Voyage
- Odyssey - Reporting
- Odyssey - Querying Element Visitors in Audience Builder
- Odyssey - Using Profiles
- Odyssey - Creating Custom Templates
- Odyssey - Global Settings
- Odyssey - Email Conditions
- Odyssey - Omeda's Email Designer
- Odyssey - Email Designer Templates
- Odyssey - Voyage Templates
- Odyssey - Merging Paths
- Odyssey - Email Merge Variables
- Odyssey - Error Troubleshooting
- Odyssey - Dynamic Content
- Show all articles (1) Collapse Articles
-
-
-
Data Management & Governance
-
- Odyssey - Querying Element Visitors in Audience Builder
- Audience Builder - Product Field Library
- Examples of Audience Builder Queries Using Paid Fields
- Querying Your Olytics Data
- Data Loader - Querying in Audience Builder
- Email - Behavioral Data
- Audience Builder (OnQ) - Date Field Definitions
- Audience Builder - How To Query Customers
- Audience Builder (OnQ) - Query Result Outputs
- Audience Builder - Overview
- Reports - Audience Builder Reporting
- Audience Builder - Admin User Guide
- Audience Builder (OnQ) - Advanced Features
- Audience Builder (OnQ) - Match Evaluation
-
- Client Empowerment: Message Types
- Client Empowerment: Profiles
- Client Empowerment: API Keys
- Client Empowerment: Alternate IDs
- Client Empowerment: Logos
- Client Empowerment: Demographics
- Client Empowerment: Database Settings
- Client Empowerment: Behaviors
- Client Empowerment: Deployment Products
- Client Empowerment: Deployment Types
- Client Empowerment : Managing Your Database
-
- Data Loader - Webhooks
- Data Loader - Loading Data
- Data Loader FAQs
- Data Loader Introduction
- Data Loader - Basic Navigation
- Data Loader - Querying in Audience Builder
- Data Loader - Templates
- Data Loader - Validation Rules by Use Case
- Data Loader - FTP Sites
- Data Loader - S3 Buckets
- Data Loader - Controlled Magazine Data
-
-
Subscription & Fulfillment Management
-
Forms & Landing Pages
-
- Form Builder Overview
- Form Builder - Form Dashboard
- Form Builder - Content
- Form Builder - Integrations
- Form Builder - Expressions
- Form Builder - Create a Form
- Form Builder - Settings
- Form Builder - Form Categories and Form Types
- Form Builder - Builder
- Form Builder - Error Log
- Form Builder - Payment Gateways
- Form Builder ADA Compliance
-
- How to send a user back to your website after form submission (redirect to a return URL)
- Form Builder - Adding a This Is Not Me Widget
- Form Builder - Embedding Webforms via iFrame or Javascript
- How To Use Progressive Profiling
- Form Builder - Using the PayPal Payment Method
- Form Builder - Using Campaign Promo Codes
- Using Form Builder to capture a Behavior Subscription Attribute
- Form Builder - reCAPTCHA v3 Implementation
- How To Use A/B Testing on your Form Builder Webform (video)
- Styling Your Form Builder Forms
- Best Practices for Testing Forms
- Form Builder Forms URL Structure and Appending Parameters
- Using a Custom Domain for your Form Builder Webform
-
-
Success Use Cases
-
Professional Services
-
Video Library
-
FAQs
Reports – Audience Builder Reporting
Overview
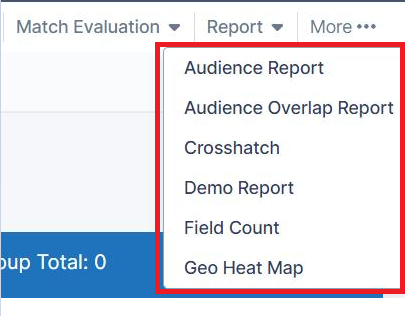
We offer several ways for you to further segment the customers within your query to enable more targeted marketing and reporting. Click on Report and here are your options:
- Audience Report – This report allows you to analyze your magazine subscription date using the basic circulation reports required by auditors such as BPA and ABC.
- Audience Overlap Report – This report allows you to select up to 5 queries and display the results as a VENN diagram so that you can see where the queries overlap.
- Cross Hatch – This report explores and compares two pieces of information about the customers.
- Demo Report – This report helps you understand the breakdown of the demographics of your queried customers. Your demographic report can contain single response, multi-response and yes/no type demographics.
- Field Count – This report allows you to create a report that breaks out information about your queried customers.
- Geo Heat Map -This report allows you to visualize where your customers are located on a map.
- Profile Report
Audience Report
This report allows you to analyze your magazine subscription date using the basic circulation reports required by auditors such as BPA and ABC. Audience reports are only available for brands that have audited magazine products. To create this report:
- Ensure you have a query created already.
- Click Report > Audience Report and the Audience Report window will appear.
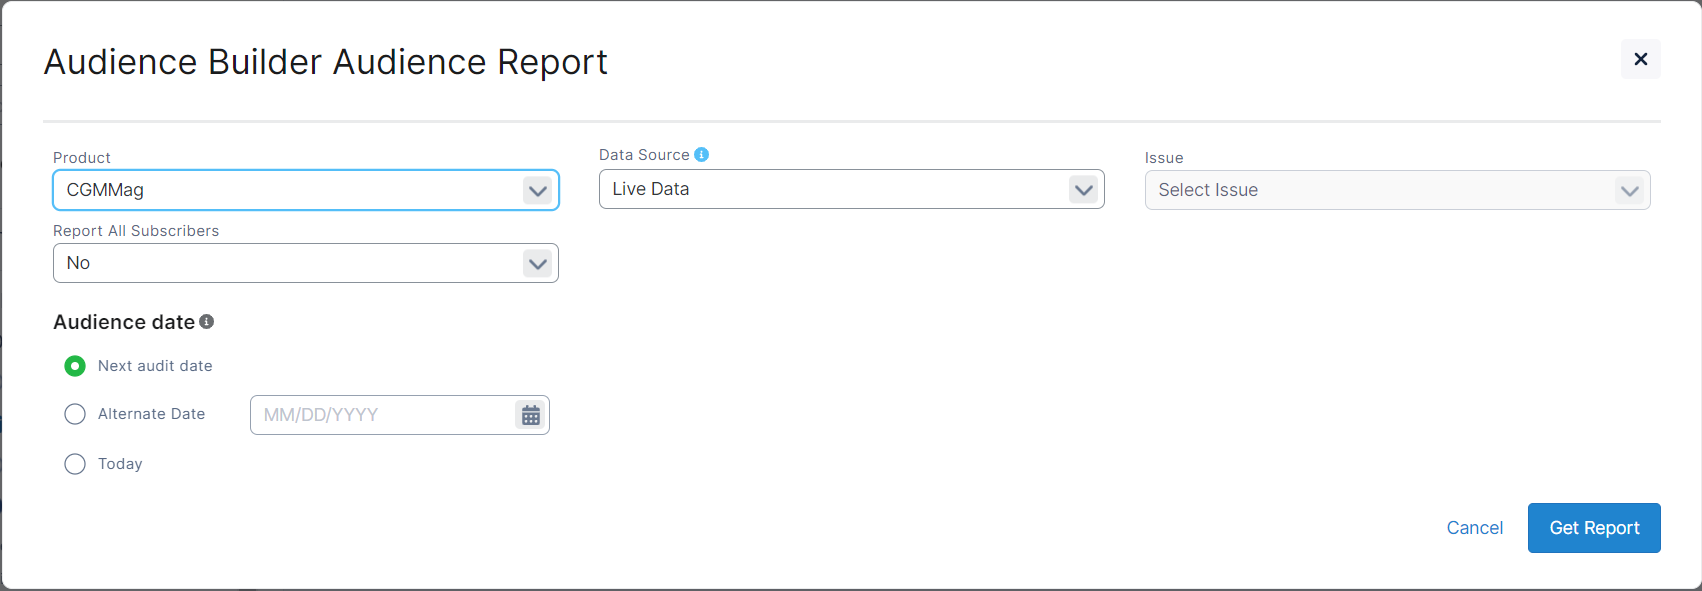
- Choose the following information:
- Audience Report – choose any of your audited magazines
- Report All Subscribers as Active Qualified – Selecting “yes” allows you to view your circulation numbers if all customers in your query were active qualified.
- Data Source – Choose Live data or modeling data for an issue that is being prepared
- Audit Date – allows you to look at your circulation as of your next audit, today or on any date of your choosing.
- Click Get Report and your report will be prepared.
You can page export the report in a variety of formats, by selecting your desired format and then clicking on the export link.
Audience Overlap Report
Within Audience Builder, you now have an option to run an Audience Overlap Report. This can be found in the Audience Builder menu bar under “Report”. This report allows you to select up to 5 saved queries to see how the audiences within those queries overlap, resulting in a Venn diagram. Venn diagrams enable you to organize your audiences visually so you are able to see the relationships between two or more sets of data.
For instructions on pulling this report, check out Audience Overlap Report
Cross Hatch Report
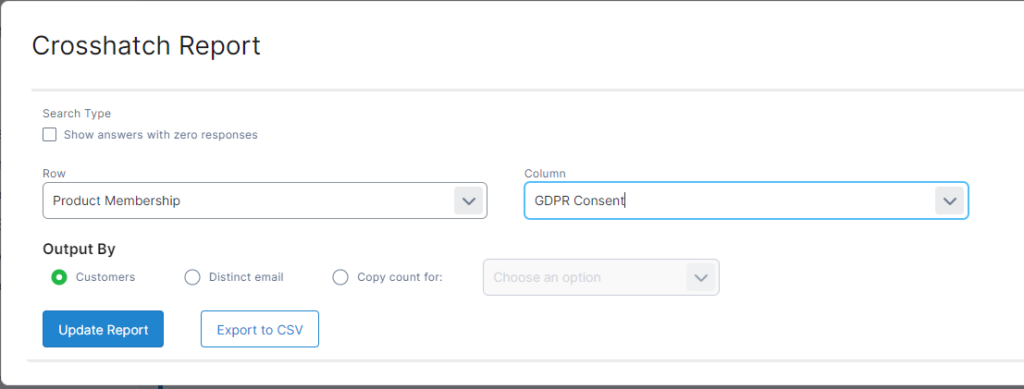
With this report, you can explore two pieces of information about the queried customers. For example, to determine which business types in the medical industry have the highest Sales or customers from which states had the highest attendance at your conference. To create this report:
- Ensure you have a query created already.
- Click Report > Cross Hatch Summary and the Cross Hatch report window will appear.
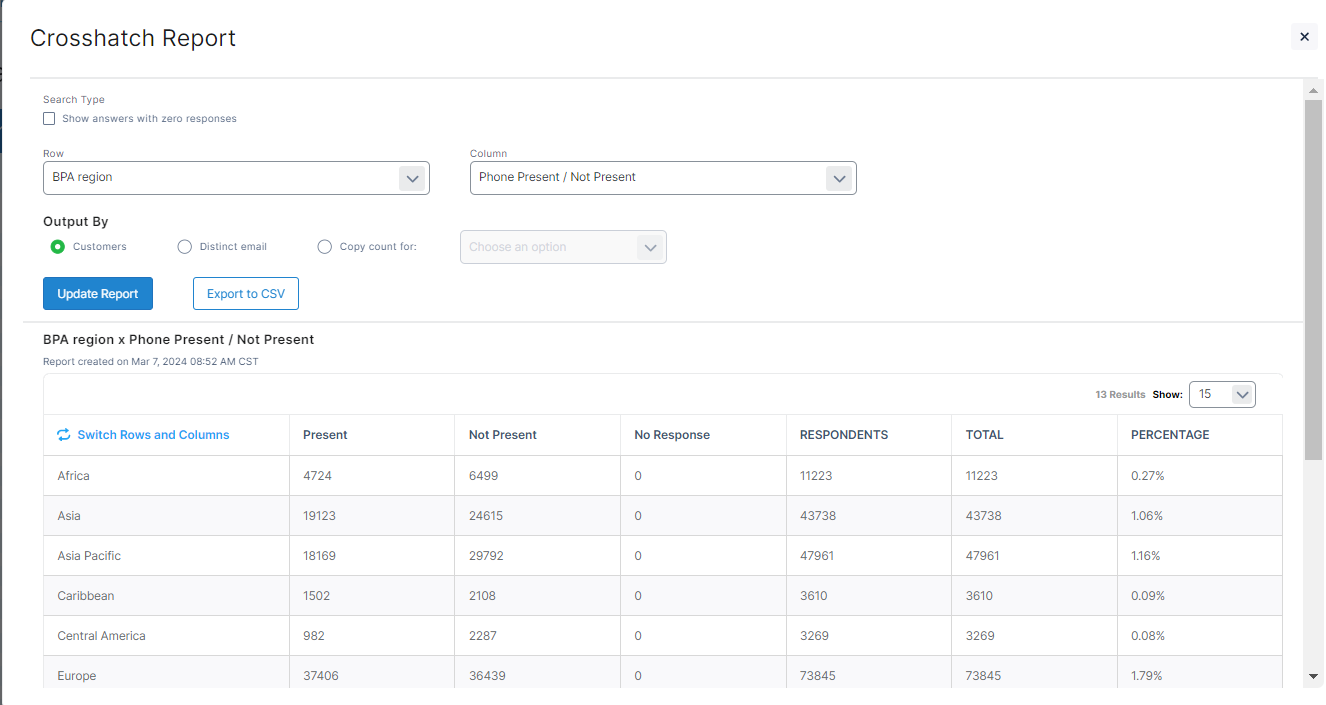
- Select the field you want for the Row and for the Column
- Click Get Report to view the report
- Within the report, you may click on any count and get a list of customers who match those criteria. The file contains the customer id, email address, first and last name, title, company name, street, city, state/province, zip/postal code and country.
- To switch the row and column value, click the Switch button.
- To export the report to a comma delimited file which can be opened in excel, click the Export button.
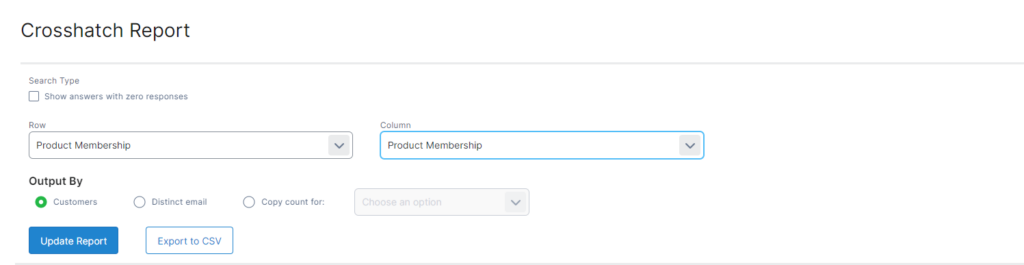
Product Membership Cross Hatch Report
When viewing a Product Membership cross hatch report in Audience Builder, you have the ability to toggle between active and all. The criteria of ‘active’ and ‘all’ can be found here.
Demo Report
This report helps you understand the breakdown of the demographics of your queried customers. Your demographic report can contain single response, multi-response and yes/no type demographics. Please contact your Account Representative for assistance in configuring the demographics that you want included in your report. To create this report:
- Ensure you have a query created already.
- Click Report > Demo Report and the report window will appear.
- Click the “Export Demo Report Email” button to receive a copy of this report via email.
Field Count Report
This report allows you to view and export counts for one of your database fields based on the customers selected in a query. For example, how many people live in each US state or how many people work for the various divisions of IBM. To create this report:
- Ensure you have a query created already.
- Click Report > Field Count and the report window will appear.
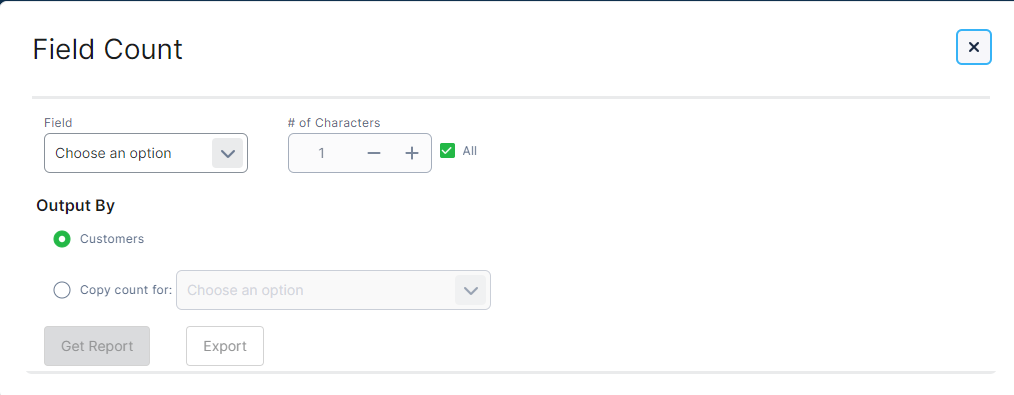
- Select the field in which you are interested in receiving counts.
- Choose the number of characters you want the report based on. For example, the first 5 characters of the company name. If you select a single or multi-response demographic field, you do not need to enter the number of characters for the report to generate.
- Click Get Report to view the report.
- To export the report to a csv file which can be opened in excel, click the Export button.
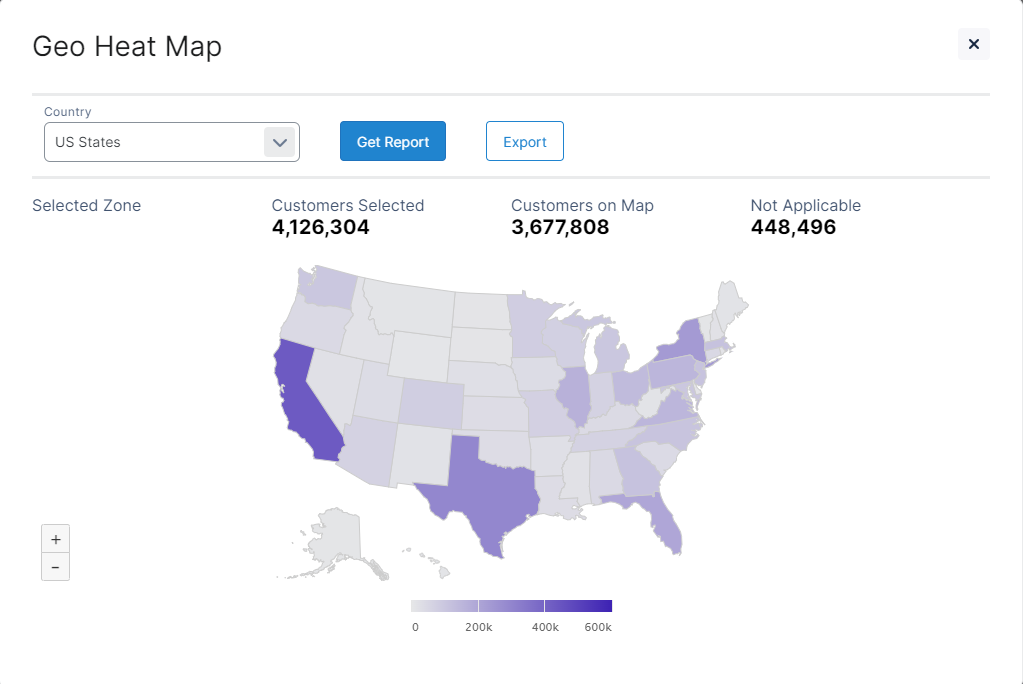
Geo Heat Map
You can visualize where your customers are located on a map using the Geo Heat Map. To create this report:
- Ensure you have a query created already.
- Click Report > Geo Heat Map and the report window will appear.
- Select any of the display formats(Countries, US States, Canadian Provinces, SCF) and click Get Report.
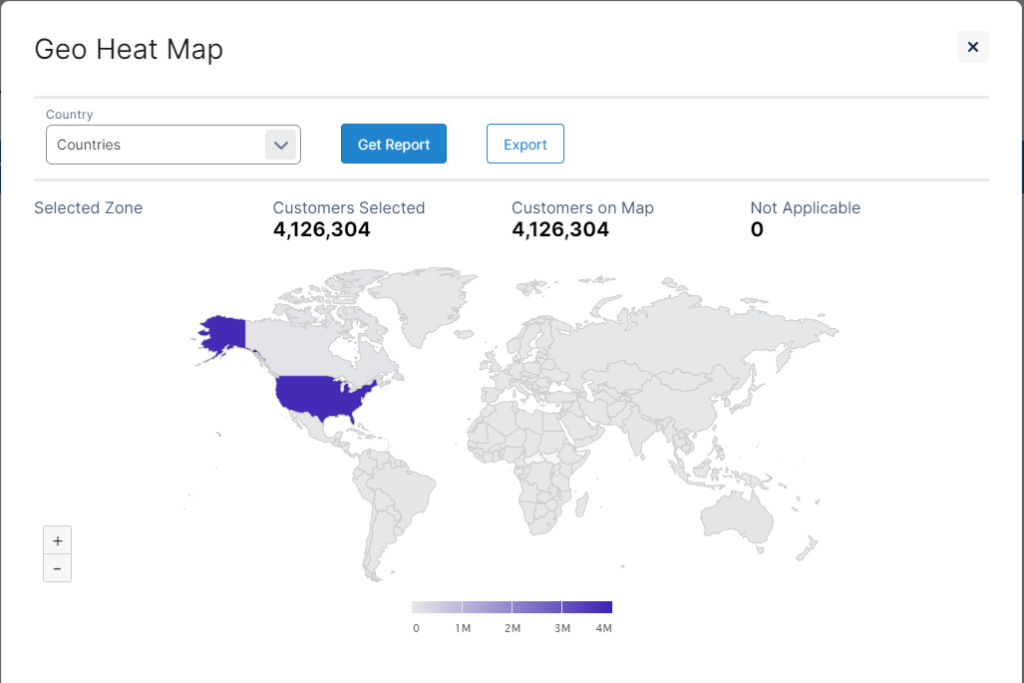
The contact rule chosen in OnQ determines the address of the customer displayed in the map. Customers Selected = Customers On Map + Not Applicable. If you select US States display, then a customer with a Canadian address will be counted as “Not Applicable”.
The display color ranges from blue (few customers) to purple (moderate number of customers) to red (many customers). The regional information and the exact customer count will be displayed as you hover over each region. If you select SCF display,a dot will be placed for each SCF that has at least one customer. The size and color of the dots reflects the number of customers in each SCF.