Search the Omeda Knowledge Base
-
The Omeda Experience
-
Documentation
-
-
- Brand Comprehensive Lookup Service
- Brand Promotions Quantity
- Brand Group Lookup
- Brand Promotions Content By Promo Code
- Brand Promotions By Promo Code
- Behavior Categories Lookup
- Behavior Actions Lookup
- Behavior Lookup Grouped By Product
- Behavior Lookup By Id
- Behavior Lookup
- Demographic Lookup by Brand API
- Deployment Type Lookup by Brand API
- Product Lookup by Brand API
-
- Customer Lookup By Email Address
- Subscription Lookup By Customer Id
- Order History Lookup by Customer Id
- Customer Lookup by Hashed Email Address
- Email Address Lookup By Customer Id
- Gift Lookup by Donor ID
- Behavior Lookup By Customer Id
- Subscription Lookup By Email
- Customer Merge History Lookup
- Customer Lookup By Name and Country
- External ID Lookup By Customer Id
- Demographic Lookup By Customer Id
- Phone Lookup By Customer Id
- Postal Address Lookup By Customer Id
- Customer Change Lookup
- Customer Comprehensive Lookup By Customer Id
- Customer Lookup By EncryptedCustomerId
- Customer Lookup By External ID
- Customer Lookup By PostalAddressId
- Customer Lookup By Customer Id
- Email Validity Lookup API
- Behavior Attribute Lookup by Customer Id
- Order Issue History Lookup by Customer Id
- Show all articles (8) Collapse Articles
-
- Email On Demand Send
- Email Deployment
- Email Deployment Clone
- Email Deployment Remove Audience
- Email Audience Assignment Status
- Email Deployment Content
- Email Deployment Approval Lookup
- Email Deployment Schedule
- Email Deployment Cancel
- Email Deployment Search
- Email Flag Email As Invalid
- Email Clicks
- Email - Checklist for Sends Created via API Calls
- Email Deployment Content Lookup
- Email Deployment Unschedule
- Email Deployment Lookup
- Email Deployment Test
- Email Deployment Add Audience
- Email Opt In/Out Lookup
- Email Optout Queue
- Email Optin Queue
- Email Deployment Audience List FTP
- Show all articles (7) Collapse Articles
-
-
- Release Notes for Feb. 2 | V24.2
- Release Notes for Feb. 23 | V24.3
- Release Notes for Mar. 15 | V24.4
- Release Notes for Apr. 5 | V24.5
- Release Notes for Apr. 26 | V24.6
- Release Notes for May 24 | V24.7
- Release Notes for June 7 | V24.8
- Release Notes for June 28 | V24.9
- Release Notes for July 19 | V24.10
- Release Notes for Aug. 9 | V24.11
-
- Release Notes for Jan 27 | V23.2
- Release Notes for Feb 17 | V23.3
- Release Notes for Mar 10 | V23.4
- Release Notes for Mar 31 | V23.5
- Release Notes for Apr 21 | V23.6
- Release Notes for May 19 | V23.7
- Release Notes for June 2 | V23.8
- Release Notes for June 23 | V23.9
- Release Notes for July 14 | V23.10
- Release Notes for Aug 4 | V23.11
- Release Notes for Aug 25 | V23.12
- Release Notes for Sep 15 | V23.13
- Release Notes for Oct 6 | V23.14
- Release Notes for Oct 27 | V23.15
- Release Notes for Nov 16 | V23.16
- Release Notes for V23.17
- Show all articles (1) Collapse Articles
-
- Release Notes for Jan 14 | V22.1
- Release Notes for Feb 4 | V22.2
- Release Notes for Feb 25 | V22.3
- Release Notes for Mar 18 | V22.4
- Release Notes for Apr 8 | V22.5
- Release Notes for Apr 29 | V22.6
- Release Notes for May 20 | V22.7
- Release Notes for June 10 | V22.8
- Release Notes for July 1 | V22.9
- Release Notes for July 22 | V22.10
- Release notes for Aug 12 | V22.11
- Release Notes for Sep 2 | V22.12
- Release Notes for Sep 23 | V22.13
- Release Notes for Oct 14 | V22.14
- Release Notes for Nov 4 | V22.15
- Release Notes for Dec 2 | V22.16
- Show all articles (1) Collapse Articles
-
- Release Notes for V21.1
- Release Notes for V21.2
- Release Notes for V21.3
- Release Notes for V21.4
- Release Notes for V21.5
- Release Notes for V21.6
- Release Notes for V21.7
- Release Notes for V21.8
- Release Notes for V21.9
- Release Notes for V21.10
- Release Notes for V21.11
- Release Notes for V21.12
- Release Notes for V21.13
- Release Notes for V21.14
- Release Notes for V21.15
- Release Notes for V21.16
- Release Notes for V21.17
- Show all articles (2) Collapse Articles
-
- Release Notes for V20.1
- Release Notes for V20.2
- Release Notes for V20.3
- Release Notes for V20.4
- Release Notes for V20.5
- Release Notes for V20.6
- Release Notes for V20.7
- Release Notes for V20.8
- Release Notes for V20.9
- Release Notes for V20.10
- Release Notes for V20.11
- Release Notes for V20.12
- Release Notes for V20.13
- Release Notes for V20.14
- Release Notes for V20.15
- Release Notes for V20.16
- Release Notes for V20.17
- Show all articles (2) Collapse Articles
-
- Release Notes for V19.1
- Release Notes for V19.2
- Release Notes for V19.3
- Release Notes for V19.4
- Release Notes for V19.5
- Release Notes for V19.6
- Release Notes for V19.7
- Release Notes for V19.8
- Release Notes for V19.9
- Release Notes for V19.10
- Release Notes for V19.11
- Release Notes for V19.12
- Release Notes for V19.13
- Release Notes for V19.14
- Release Notes for V19.15
- Release Notes for V19.16
- Release Notes for V19.17
- Show all articles (2) Collapse Articles
-
-
-
CDP – Customer Data Platform
-
-
- Personalization Overview
- Personalization - FAQs
- Personalization - Reporting
- Personalization - Archiving & Restoring
- Personalization - HTML Templates
- Personalization - Scroll Trigger and Infinite Scroll Pages
- Personalization - Merge Variables
- Personalization - 'Generate Personalization' Option
- Personalization & Metering - Click Tracking
- GDPR Consent Management
- Personalization - A/B Testing
-
-
Integrations
-
-
- Integration with Zapier
- Bring Customer Data in via Webhooks by Zapier Action - POST Event
- Bring Customer Data in using Zapier
- Omeda's Add Customer Action in Zapier
- Send Form Submission Data via Zapier
- Bring Customer Data in via Webhooks by Zapier Action – Custom Request Event
- Formatter by Zapier Action
-
-
-
Analytics & Reporting
-
- Odyssey - Reporting
- Personalization - Reporting
- Reports - Email Device and Client Type Reporting
- Email - Clickbot Reporting
- Reports - Email Reporting
- Metering - Reporting
- Reports - Audience Overlap Report
- Reports - Engaged Companies Report
- Reports-AutoRenewals Analysis Report
- Reports - Audience Report
- Reports - Issue Activity Reporting
- Reports - Overview
- Reports - Web Behavior Reporting
- Reports- FAQs
- Reports - Data Tracker Reporting
- Reports - Audience Builder Reporting
- Form Submit Report
- Behavior Promo Code Report
- Reporting Library
- Show all articles (4) Collapse Articles
-
Marketing Automation & Email Builder
-
-
- Email On Demand Send
- Email Deployment
- Email Deployment Clone
- Email Deployment Remove Audience
- Email Audience Assignment Status
- Email Deployment Content
- Email Deployment Approval Lookup
- Email Deployment Schedule
- Email Deployment Cancel
- Email Deployment Search
- Email Flag Email As Invalid
- Email Clicks
- Email - Checklist for Sends Created via API Calls
- Email Deployment Lookup
- Email Deployment Test
- Email Deployment Add Audience
- Email Opt In/Out Lookup
- Email Optout Queue
- Email Optin Queue
- Email Deployment Audience List FTP
- Show all articles (5) Collapse Articles
- Email Builder - User Guide
- Email - Clickbot Reporting
- Reports - Email Reporting
- Email - Link Tracking Errors
- Email - Deployment Defaults
- Omeda - Getting Support
- Email - Checklist for Sends Created via API Calls
- Email - Assigning Link Tracking Categories
- Email - Deliverability
- Email - Opt-Out Footer Merge Variable
- Email - Stealth Link
- Email - Behavioral Data
- Email - Automation for Email Sending
- Email - Deployment Type Creation
- Email – Training Schedules for New Clients
- Email - Request a New Deployment Type
- Email - Adding Domains to Safe Sender List
- Email - Deployment Checklist & Best Practices
- Email Deployment Unschedule
- Email Builder - Getting Started
- Campaign Tool - Overview
- Email - Automated ACS Notifications
- Email - Dynamic Content
- Email - Recurring Deployments
- Email - FAQs
- Email - Web Tracking
- Email - Validation Services
- Email Services - Overview & Capabilities
- Email - Web Tracking String Parameter Definitions
- Email - Appending Lists On Triggered Deployments
- Email - Preference Page
- Email - A/B Testing
- Email - Triggered Deployments
- Email - Merge Variables
- Email - User Set-up
- Email - Advanced Features
- Email - Glossary
- Email – Checklist for New Clients
- Show all articles (23) Collapse Articles
-
-
-
- Odyssey - Audience Element
- Odyssey - Timing Elements
- Odyssey - Adroll Elements
- Odyssey - Facebook Elements
- Odyssey - Filter Element
- Odyssey - Form Submit Element
- Odyssey - Pathfinder Element
- Odyssey - Export Element
- Odyssey - Split Element
- Odyssey - Personalization Element
- Odyssey - Metering Element
- Odyssey - Email Element
- Odyssey - Goal Element
- Odyssey - A/B Test Element
- Odyssey - Google Ad Manager Element
- Odyssey Fatigue Filter Element
- Show all articles (1) Collapse Articles
- Odyssey Overview
- Odyssey - FAQs
- Odyssey - Editing an In Progress Voyage
- Odyssey - Reporting
- Odyssey - Querying Element Visitors in Audience Builder
- Odyssey - Using Profiles
- Odyssey - Creating Custom Templates
- Odyssey - Global Settings
- Odyssey - Email Conditions
- Odyssey - Omeda's Email Designer
- Odyssey - Email Designer Templates
- Odyssey - Voyage Templates
- Odyssey - Merging Paths
- Odyssey - Email Merge Variables
- Odyssey - Error Troubleshooting
- Odyssey - Dynamic Content
- Show all articles (1) Collapse Articles
-
-
-
Data Management & Governance
-
- Odyssey - Querying Element Visitors in Audience Builder
- Audience Builder - Product Field Library
- Examples of Audience Builder Queries Using Paid Fields
- Querying Your Olytics Data
- Data Loader - Querying in Audience Builder
- Email - Behavioral Data
- Audience Builder (OnQ) - Date Field Definitions
- Audience Builder - How To Query Customers
- Audience Builder (OnQ) - Query Result Outputs
- Audience Builder - Overview
- Reports - Audience Builder Reporting
- Audience Builder - Admin User Guide
- Audience Builder (OnQ) - Advanced Features
- Audience Builder (OnQ) - Match Evaluation
-
- Client Empowerment: Message Types
- Client Empowerment: Profiles
- Client Empowerment: API Keys
- Client Empowerment: Alternate IDs
- Client Empowerment: Logos
- Client Empowerment: Demographics
- Client Empowerment: Database Settings
- Client Empowerment: Behaviors
- Client Empowerment: Deployment Products
- Client Empowerment: Deployment Types
- Client Empowerment : Managing Your Database
-
- Data Loader - Webhooks
- Data Loader - Loading Data
- Data Loader FAQs
- Data Loader Introduction
- Data Loader - Basic Navigation
- Data Loader - Querying in Audience Builder
- Data Loader - Templates
- Data Loader - Validation Rules by Use Case
- Data Loader - FTP Sites
- Data Loader - S3 Buckets
- Data Loader - Controlled Magazine Data
-
-
Subscription & Fulfillment Management
-
Forms & Landing Pages
-
- Form Builder Overview
- Form Builder - Form Dashboard
- Form Builder - Content
- Form Builder - Integrations
- Form Builder - Expressions
- Form Builder - Create a Form
- Form Builder - Settings
- Form Builder - Form Categories and Form Types
- Form Builder - Builder
- Form Builder - Error Log
- Form Builder - Payment Gateways
- Form Builder ADA Compliance
-
- How to send a user back to your website after form submission (redirect to a return URL)
- Form Builder - Adding a This Is Not Me Widget
- Form Builder - Embedding Webforms via iFrame or Javascript
- How To Use Progressive Profiling
- Form Builder - Using the PayPal Payment Method
- Form Builder - Using Campaign Promo Codes
- Using Form Builder to capture a Behavior Subscription Attribute
- Form Builder - reCAPTCHA v3 Implementation
- How To Use A/B Testing on your Form Builder Webform (video)
- Styling Your Form Builder Forms
- Best Practices for Testing Forms
- Form Builder Forms URL Structure and Appending Parameters
- Using a Custom Domain for your Form Builder Webform
-
-
Success Use Cases
-
Professional Services
-
Video Library
-
FAQs
Personalization – Reporting
Reporting on Personalization jobs can be done a few different ways: Overall stats and charts within the tool itself, individual job queries in Audience Builder and through Reports & Analytics under Web Behavior.
The stats and charts within the Personalization tool will show the total # of clicks and impressions while Audience Builder shows the # of customers who have seen/clicked at least once. The Report will provide a summary view across all Personalization jobs.
Reporting within Personalization
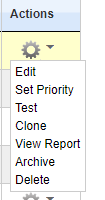
Within the tool itself, there are two ways to access reports for a personalization job. The first is by selecting ‘View Report’ from the Actions drop down to the right of the personalization job in question:
You will be able to click on the ‘View Report’ option when a personalization is in one of the following statuses:
- Active
- Passed End Date
- Paused
The second way you can access the reporting is within the Edit Personalization screen by selecting the ‘Click / Impression Report’ button:

Available Reports within Personalization
The reports are in both graph and chart format. Each report and associated chart can be exported to a PDF by selecting the ‘Output to PDF’ option in the upper left-hand corner.

Depending on who your personalization job is targeting and if you have click-tracking turned on, the following reports will be available as the job begins to fire.
Reports:
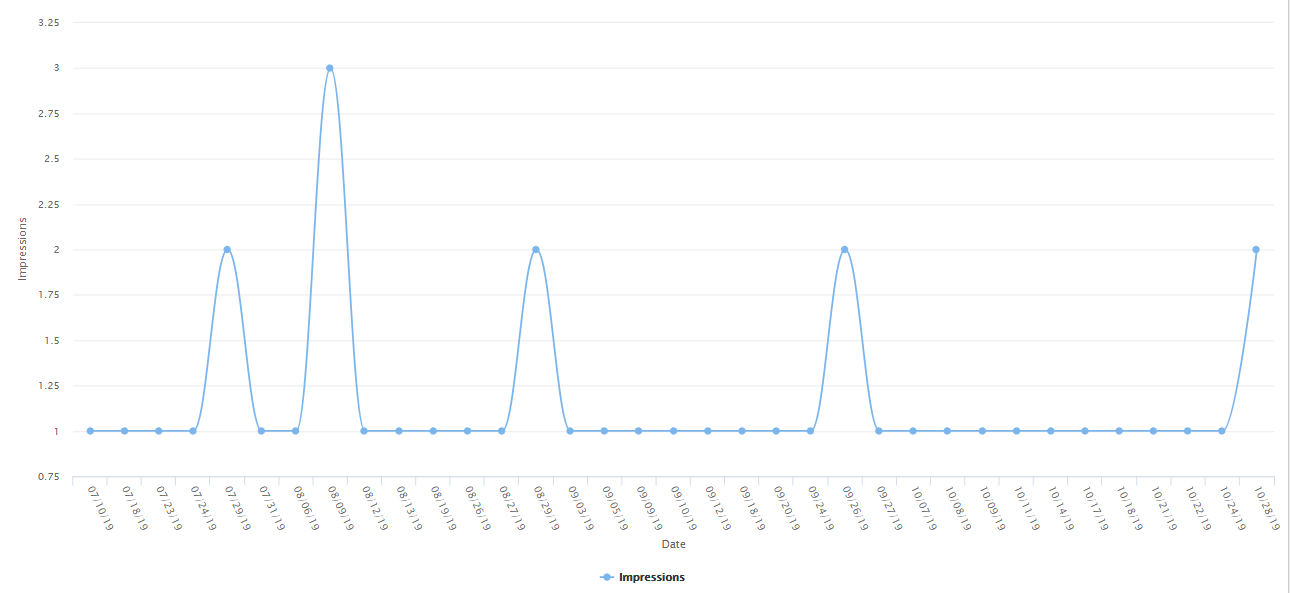
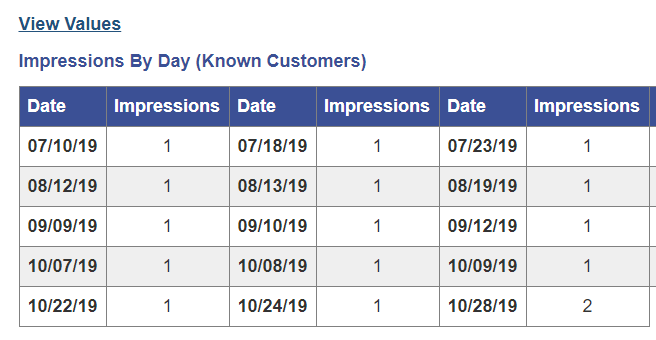
- Impressions by Day (Known Customers)
- Impressions by Day (Anonymous Traffic)
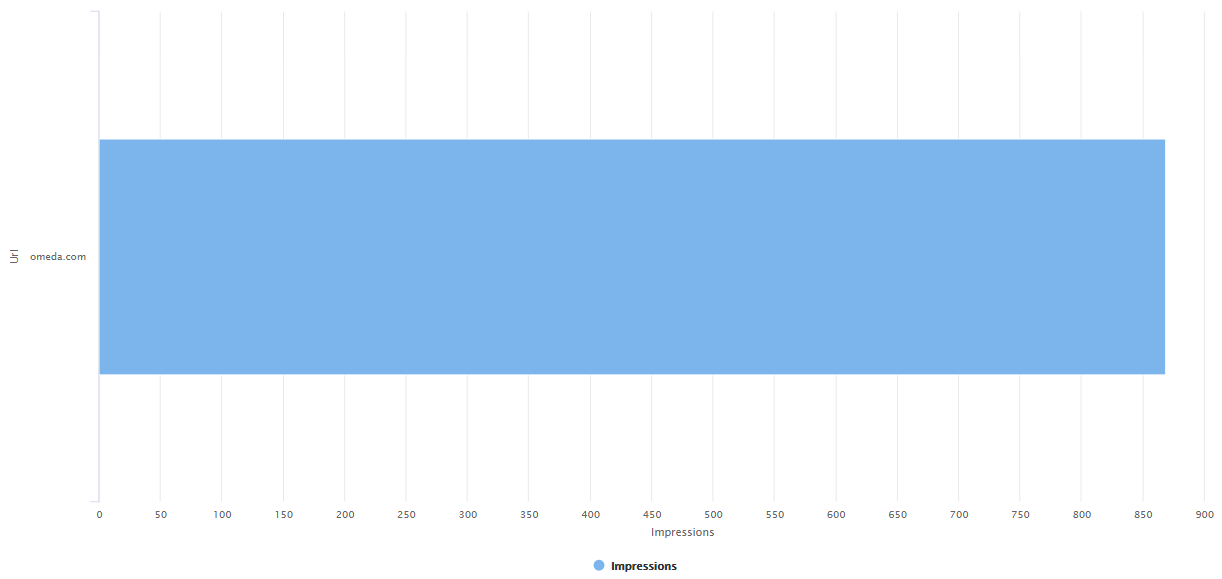
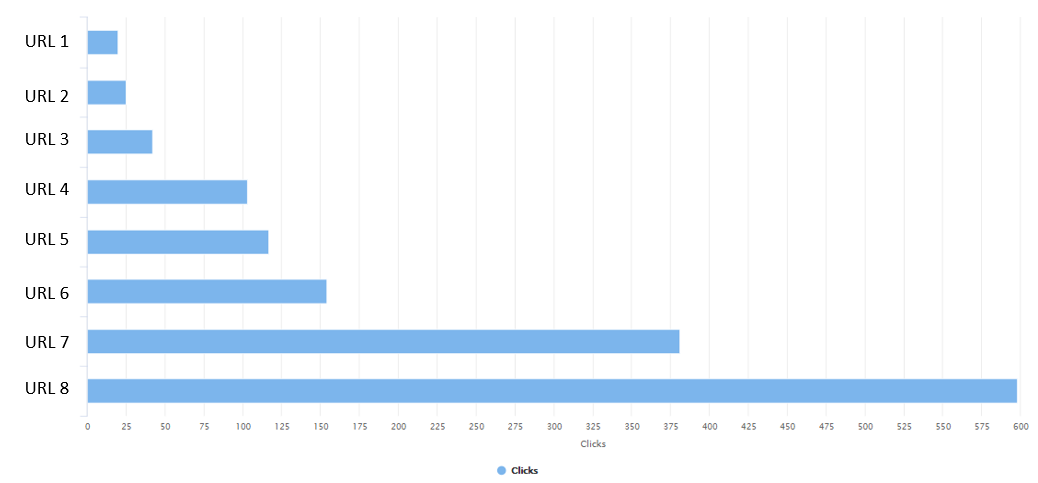
- Impressions Per Url (Top 20 Shown – Known Customers)
- Impressions Per Url (Top 20 Shown – Anonymous Traffic)
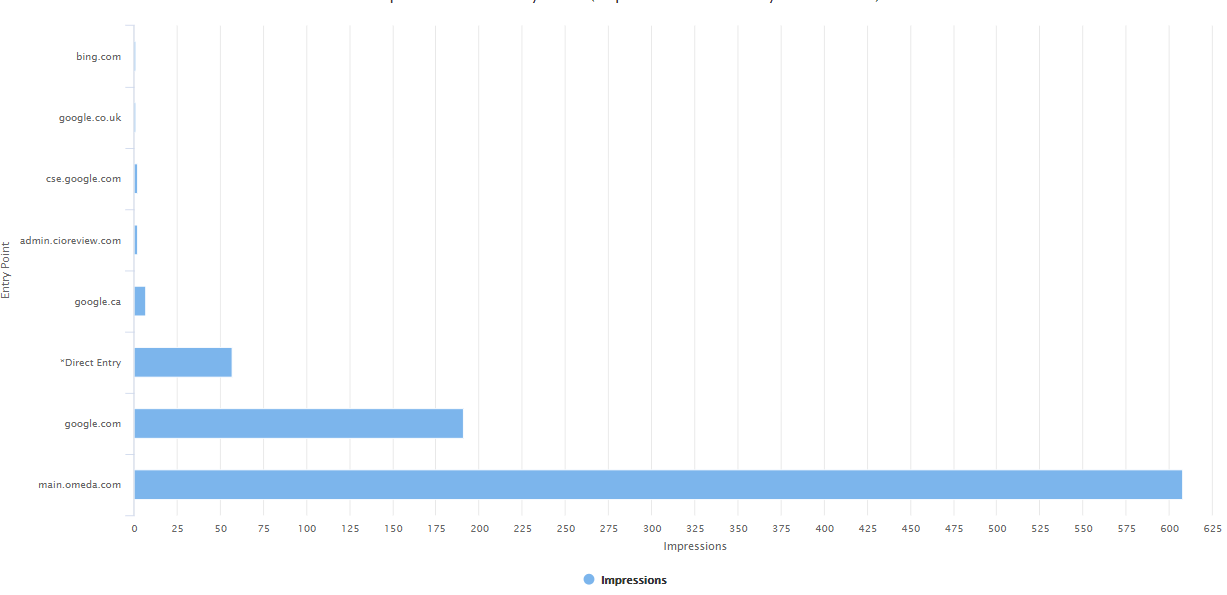
- Impressions Per Entry Point (Top 20 Shown – Known Customers)
- Impressions Per Entry Point (Top 20 Shown – Anonymous Traffic)
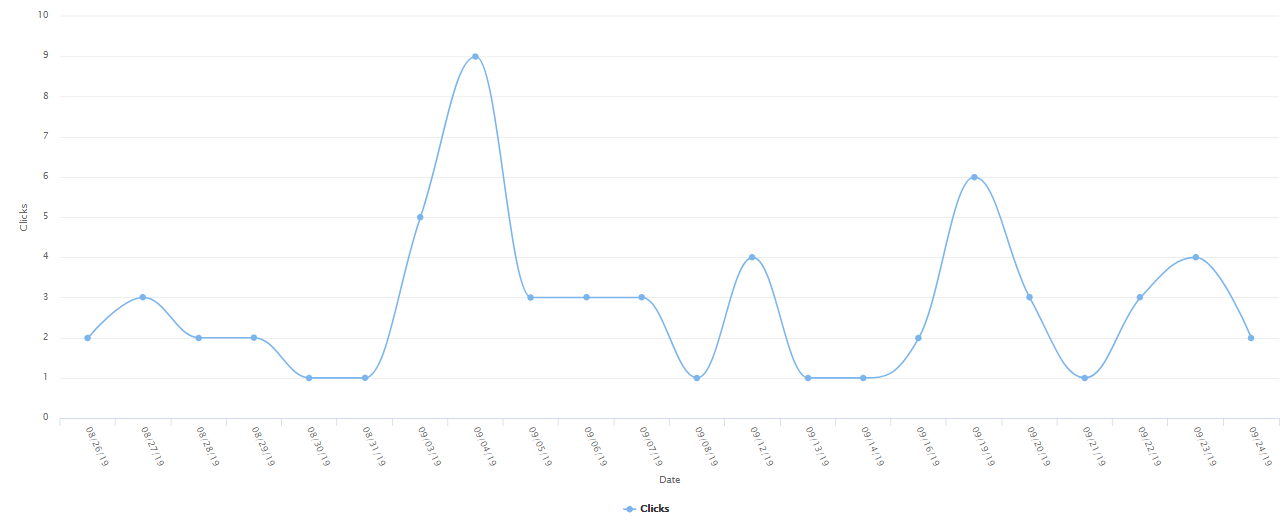
- Link Clicks by Day (Known Customers)
- Link Clicks by Day (Anonymous Traffic)
If you are running personalization jobs across multiple URLs, the following reports are also available:
- Clicks per host URL (Known Customers)
- Clicks per host URL Tracking (Anonymous Traffic)
- Clicks per Trigger URL (Known Customers)
- Clicks per Trigger URL (Anonymous Traffic)
Charts:
To access the charts, you can click “View Values” under each graph on the left-hand side. The impressions-by-day will appear. These are automatically exported whenever you select ‘Output to PDF’.
Reporting within Audience Builder
There are 2 skittles in Audience Builder you can use to pull your personalization data:
- Personalization Impressions
- Personalization Clicks

Note: If you do not see these currently in your Field Library, please contact your Audience Services team to have them configured in.
How to Query Personalization Impressions:
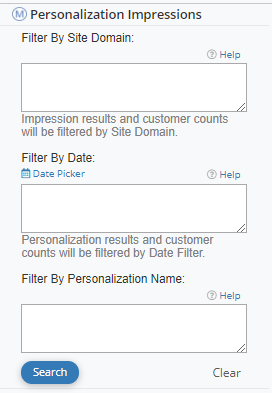
To query impressions, you have 3 options that can be used independently, or combined to pull the desired data.
- Filter by Site Domain: This is most relevant when you are running a personalization job across multiple domains. You are able to narrow down the domain in question using this box.
- Filter by Date: Enter a date range or static date in order to return the total customer impressions.
- Filter by Personalization Name: Enter the exact name (or part of a name with a wildcard *) to return a list of personalization jobs
How to Query Personalization Clicks:
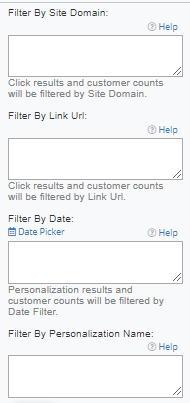
In order to query clicks, you will need to make sure that click tracking has been added to the job. To query clicks, you have 4 options that can be used independently, or combined to pull the desired data.
- Filter by Site Domain: This is most relevant when you are running a personalization job across multiple domains. You are able to narrow down the domain in question using this box.
- Filter by Link URL: If your job has multiple links or if a single link is used across multiple jobs, you can query by the link itself using this box.
- Filter by Date: Enter a date range or static date in order to return the total customer clicks.
- Filter by Personalization Name: Enter the exact name (or part of a name with a wildcard *) to return a list of links used in the job(s)
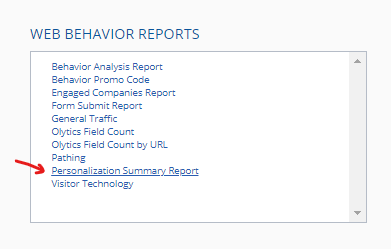
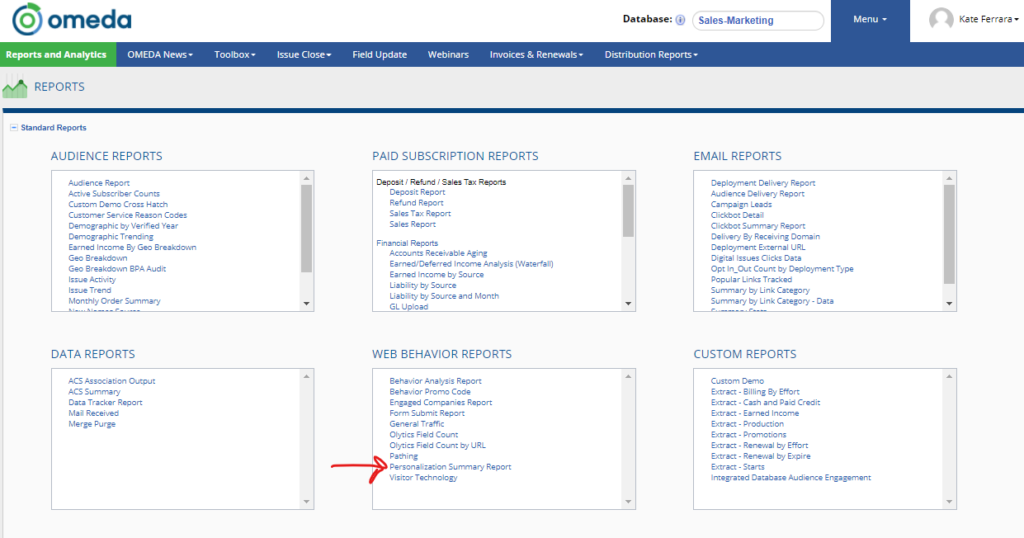
Reporting within Reports & Analytics
Personalization Summary Report
- This will provide a Summary View of Personalizations across the database. This report can be dialed into a specific or broad date range depending on the desired information and will display the following metrics:
- Total Impressions: Gross count of impressions for the Personalization.
- Known Impressions: Unique count of known people who saw the Personalization
- Anonymous Impressions: Unique count of anonymous people who saw the Personalization
- Total Clicks: Gross number of clicks on the Personalization
- Known Clicks: Unique count of known people who clicked on the Personalization
- Anonymous Clicks: Unique count of anonymous people who clicked on the Personalization
- Activation Date: Date the job was first made active
- Type: Personalization type
- Frequency: How often the Personalization is displayed
- Current Status: Job status at the time the report is generated
- Current Priority: Job priority rank at the time the report is generated
- Position: Where the personalization is displayed on the page
- Target URLs: Specific sites used to target the Personalization
- The report is located under the Web Behavior Reports on the Reporting and Analytics page of Omeda’s platform. You may need to contact your Client Success Manager to gain access.
Additional Personalization Query Tips
- Querying on iFramed Forms: If you have iFramed a form you are not able to utilize the click tracking feature. However, for Omeda-based forms, you can use the ‘Dragon Sites’* skittle to lookup form submissions. This is best used in conjunction with the Impressions skittle for the best measure of personalization driven submissions.
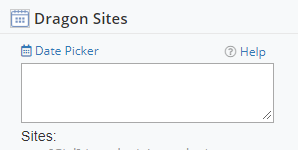
*’Dragon Sites’ may be named something else depending on your Field Library setup. If you are unable to find this field, please contact your Audience Services team.
- Querying on Conversions: If your personalization job is tied to a product within your database, you may be able to query on conversions. In order to successfully do so, you’ll need to use a unique promo code in your Personalization job. Looking up this unique promo code in Audience Builder will return the # of customers who converted via the personalization job.
- Exporting Query Data: For personalization jobs that are ongoing, you can query the desired data (e.g. impressions, clicks, etc) and set it up to export regularly using the Omeda Lead Gen tool.