Search the Omeda Knowledge Base
Reports – Email Reporting
Introduction
General Information
Our Reporting functionality allows users to view delivery and response statistics for all tracked deployments. All email sends, whether from Email Builder or Odyssey, have the ability to track delivered messages, hard and soft bounces (broken down by category), messages opened (for HTML or MIME based messages only) and URL’s clicked. Please note that we will infer an ‘open’ and increment the count when there has been a click in the text version of an email.
All reports can be exported as an Excel document. Use the diskette icon on the top row of the report when it opens, selecting Excel from the drop down.
All reports with a timestamp are in Central Standard Time for consistency.
Note: Data for the clicks on individual URL’s are archived after 13 months. After 13 months, only the top level open and click numbers for each deployment are available in reports.
Reporting within Email Builder
There are several ways to view the report for one or multiple deployments within the Search screen.
- Use the checkbox to select the deployment(s) then click the View Report option at the bottom. You will then be prompted to select either the Full Report or Summary Report (see below for description of each)
- Selecting more than one deployment is used when you would like to view the rolled-up numbers (combined report). Simply click all that you would like to view. The first page of the report will show the combined/roll-up numbers. If using the full Deployment Delivery report, you can then click either the View Throughput and Response Stats By Deployment/Split or the View All By Deployment/Split to see the numbers for each deployment. If using the View Summary version, there will be a separate page for each selected deployment.
- Open the row, select either the View Summary or View Report option. See below for the details and differences in each.
When opening the row, the following options are present:
Supplemental Data
This option will provide the top level delivery data but will not have the complete reporting functionality. This report will also provide delivery information on the seeds for the deployment (data for deliverability and opens/clicks is not tracked for seed names in any report except for the Clickbot Detail report). The Digital Audit reports are also located within the Supplemental Data page and are exportable.
Get External URL
This provides a live URL which will generate the Summary report (see below). You can either cut/paste the URL as needed or use the option to have that live URL sent to a list of email addresses. Each time the URL is rendered, updated data is provided.
View Summary
The Deployment Delivery Summary report summarizes the delivery information for an individual deployment or multiple deployments within a Database. When viewed within the portal, the Preview Content link and the Heat Map link are functional. The report provides the final list quantity, number delivered, and bounced with sub-totals for the hard and soft bounces. The opens (unique and gross), clicks (unique and gross), forward to a friend, and unsubscribes with the corresponding percentages. The Unique and Gross click counts for each URL are then presented. The numbers are not clickable in this report. Please note that if the deployment is still in a sending status, the Delivered Quantity plus the Bounced Quantity will not equal the Final List Quantity. Once the deployment has been moved to the ‘sent’ status, the numbers will balance.
View Report
This is the complete Deployment Delivery Report of all delivery and engagement information for an individual deployment or multiple deployments within a database. The report provides the original quantity of the list(s) used, any suppressions that were applied, the number deployed, delivered, bounced, deferred, opened, clicked, unsubscribed, and the corresponding percentages. This report provides both Unique and Gross numbers for the Open and Click rates in addition to the click counts for each URL. Depending on user access, the reported numbers are clickable to allow you to drill in and view the actual recipients and their contact, demographic or other predefined data fields in the audience list. This report is available for a single deployment or a combination of deployments (see above for this functionality).
Additional Reports available within the full Deployment Delivery Report
Other reports are accessible by clicking the corresponding button. Here is a list along with details on each.
View Deployment Details
This report displays all the technical details of the email deployment including all of the seed email addresses.
View Deployment Content
View actual content code for both HTML and Text versions.
Deployment Graphs
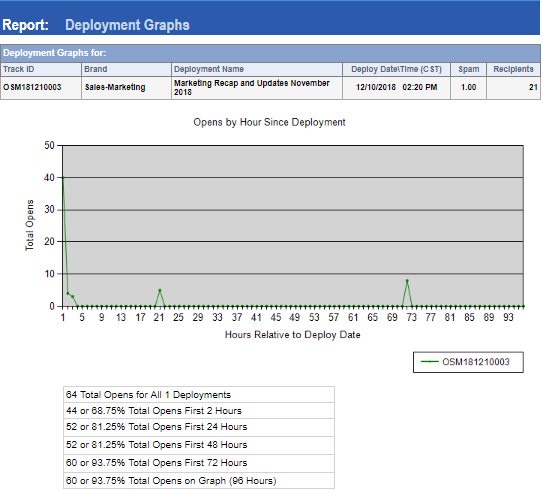
This option will show you Opens by Hour Since Deployment data/graph on page 1 and the Clicks by Hour Since Deployment data/graph on page 2. This graph tracks the Opens and the Clicks, by hour, for 96 hours. This report is extremely helpful when analyzing exactly how long the engagement lasts with each particular send. This report is also helpful when testing different send times. First, run the combined report (see above) over the deployments you would like to analyze – the graph will overlay each send and easily allow you to review the data points where the most opens and clicks occur.
View Heat Map Displays unique and gross click data as an overlay on your actual content. The Heat Map is only able to show clicks that occurred on the html version. Text version clicks cannot be tracked in the heat map. You can click the “printable format” link in the top right to download the report. 
View Open Click Analysis This report will analyze the audience lists used for a specified deployment type (within a database) over a specified time frame. To access this, select all of the deployments that you wish to analyze then select View Report to see the combined deployment delivery report. When you click on the View Open Click Analysis, the report provides the total number deployed and delivered plus the total unique number delivered. The report then also analyzes each of the deployment lists and provides a report of the breakdown by x number of times the unique opens, the unique clicks, and the delivered never opened occurrences. This report is useful when reviewing the engagement factor for a particular type of deployment. You can easily click through on the ‘Delivered Never Opened” number to get the customers and then add them to a re-engagement campaign. 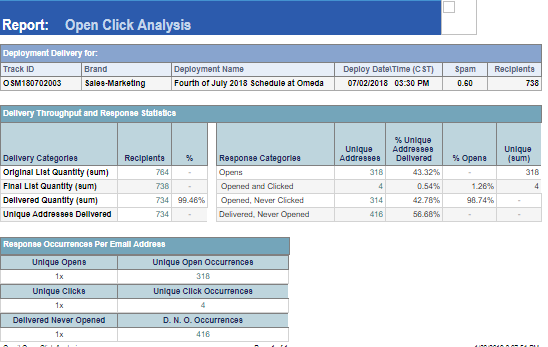
Opens by Client and Device
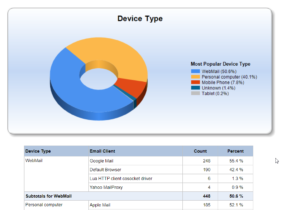
This option will show you the Device Type and Email Client report for all recipients who opened the deployment. On the first page of the report, you will see a pie chart of all device types used to open the deployment. For recipients who opened the deployment using a Webmail application like Gmail or Yahoo, the device type is not available. Because of this, they are broken out into their own device type category, Webmail. Below the pie chart, the Email Clients for each Device Type will be further broken out.
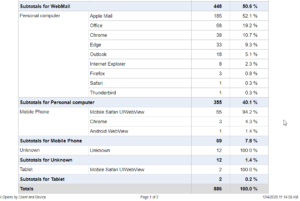
On Page 2, a break out of only Email Clients will be listed, descending from the Email Client with the most opens.
Demographic Breakdown
This option will show you the open and click activity by selected demographic values. Note: this report is only available on a single deployment since the engagement data would be different across difference deployments.

You can declare the demographic values to display in Tools -> Deployment Defaults -> check the box for Demographics Breakdown Report at either the Database or Deployment Type level.
View Preference Page Report If you are currently using an Email Builder Preference Page this report offers detailed statistics on opt-ins and opt-outs through your preference page. See information here
View Throughput and Response Stats By Deployment/Split If you had more than 1 split or if you are running a combined report, the first page of the Deployment Delivery Report will show the roll-up numbers across all splits. By clicking this option, you will see separate delivery statistics for each split or for each selected deployment.
View All By Deployment/Split As above, this option will show the entire Deployment Delivery Report for each separate split or deployment selected.
Delivery Throughput and Response Statistics
The Delivery Categories sections provides the basic delivery information broken up into the following sections:
Original List Quantity
This is the quantity of the list before any filters or suppression files were applied.
Filtered will show the number of email addresses removed due to a preexisting optout in the filter
Suppressed will show the number removed due to either an external list or domain suppression and/or data stored in the Deployment Defaults
Deduped will show the number of email addresses removed if the option to dedupe was selected. Please note that if a seedname is also in the audience list, it will be deduped and removed from the audience list. Only the seed record will be sent. Omeda does not track any open or click activity on a seed record. See Supplemental Data above.
Invalid E-Mail Address would be any email address without the proper formatting
External File Hard Bounce – Omeda does store all hard bounced email addresses from externally uploaded files. If an external list is used and the option is selected to suppress the prior hard bounces, this will show the count removed
The Final List Quantity is the Original List Quantity minus the filters and suppressions. This is the number which will be queued to send.

Delivered Quantity
This section reports on the final list quantity and the amount of that quantity that was delivered.

Final List Quantity This is the quantity of the list when it deployed
Delivered Quantity This is the number of delivered messages. For a message to be considered delivered, a sent or accepted status must be received from the receiving server.
Bounced Quantity
This is the total number of sent messages that have bounced. This number is broken out into sub-categories based upon the RFC codes returned by the receiving server or by rules using text matching on the responses received by the receiving server.
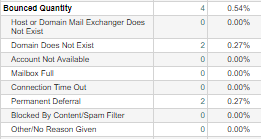
Bounced Sub-Categories
Hard Bounces
Host or Domain Mail Exchanger Does Not Exist – returned when the top level domain does not exist
Domain Does Not Exist – This is returned when the receiving domain of the email address does not exist
Account Not Available – This is the response for non-existent email addresses at working domains
Soft Bounces
Mailbox Full – The receiving mailbox is at capacity
Connection Time Out – Our attempt to connect to the receiving server timed out before we could deliver the message
Permanent Deferral – A deferral that continues past our normal 72 hour sending period
Blocked By Content/Spam Filter – the message could not be delivered due to a spam block
Other/No Reason Given – Either no reason for the block was given or we received an uncommon response from the server
Misconfiguration at Remote Mail Site = the server we are trying to deliver to is not configured to properly return accurate RFC data after receipt of the email
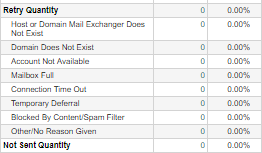
Retry Quantity
This is the total number of messages that are in a deferred state and that will continue to tried to be sent for up to 72 hours. For a message to be deferred, a deferred response is received from the receiving server. It is also possible for a message to be deferred if the connection between Email Builder and the receiving server is broken. This number is broken out into sub-categories.
Response
Response Categories provide the number of responses from a deployment. The unique responses consist of unique response to a message. The gross response consists of the multiple responses to a message. For example, if end user A receives a message that has one link and they proceed to click on that link three times, one click would be counted in the unique number and 3 clicks would be counted in the gross number.
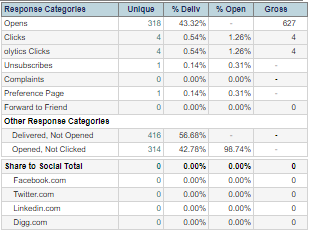
Opens This is the number of messages that were opened. A message is considered opened if the 1×1 tracking pixel embedded in the HTML is rendered or if a link is clicked in a plain text email.
Clicks This is the number of clicks on the links within the deployment.
olytics Clicks This is the number of clicks on the links within the deployment that carry the olytics tag.
Unsubscribes This is the number of clicks on the unsubscribe links. These clicks will only be counted if the Email Builder unsubscribe link is used within the message content. This also includes the Complaints
Complaints This is the number of complaints that are received from the various feedback loops from the major ISPs. A feedback loop is created for each domain/IP address so that if the end recipient clicks the “This is spam” button, the responses are sent back to Email Builder for processing. When a recipient clicks the ‘this is spam’ link, their email address is added to the Email Builder filter as an Opt-Out for every single deployment type. That email address will then also added as an optout for any new deployment type that is created. A customer can opt back in individually for each deployment type but it must be an explicit opt in. Note: The Complaints are included in the Unsubscribe count.
Forward to a Friend This is the number of clicks on the Email Builder Forward to a Friend link.
Delivery by Top 50 Domain
The delivery statistics based upon domain is provided in this section. The top 50 domains from the final list appear in this section.
An Additional Domain Report is also offered in this section. This option appears directly below the Subtotal row of the Top 50. The Additional Domain report will provide delivery statistics based on the top 50 ISPs and also the top 50 corporate domains from the final list.
Delivery By Top Level Domain – Top 10
This contains the delivery statistics based upon the top level domain. A top level domain is the extension of an email address. For example, a top level domain would be .com, .net, .mil, .edu, etc. The top 10 from the list that deployed are analyzed in this section.
Tracking Links Clicked
This section provides a breakdown on the links that were clicked in the message. The English name of the link that was entered when the deployment was created is provided, along with the actual url, and the unique and gross number of clicks. There also is a column to denote if the url was tagged for olytics. If you have a mailto: link in the email, it will also be included in the click tracking count – NOTE: the ability to track this can be turned on and off in the Email Builder Deployment Defaults.
This Tracking Links section is broken down by Combined Links, HTML Links, and Text Links. The Combined Links are a combination of links found in the text and HTML content. The Combined links section is sorted descending by the most clicked to least clicked. The html and text sections are sorted in the order the link appeared in the email.
NOTE: clicks are counted per URL in this section. The numbers will most likely exceed the page 1 Click count since that is only counting the number of recipients that clicked.
Combine URLs
The Combined URL Report allows users to download subscriber information based on an individual url or a combination of urls. Users are able to chose between downloading unique email address or unique recipients, as well as, choosing text only links, HTML only links, or a combination of text and HTML links.
![]()
Additional Reporting Options
Within Email Builder:
Summary Stats
This report is available on the navigation bar. The data in the summary stats report is compiled as of the previous day – it is run off of tables updated at night due to the amount of data it must generate. The report cannot be used for deployments that occurred ‘today’ since they would not be in the nightly table update. The report will provide summary report data for all deployments over the user defined parameters of designation and time-frame, with unique and/or gross click numbers. In addition, the user can select by individual deployment types and/or sending domain. The user can then also select the columns of data that are desired in the report – such as deployed, delivered, opened, clicked, unsubscribed and the corresponding percentages. Counts for splits within each deployment are also displayed.
The report provides 4 sheets of data when downloaded into Excel. Sheet 1 is each individual deployment. Sheet 2 is a roll-up by deployment type. Sheet 3 is a roll-up by Quarter. Sheet 4 is a roll-up by year
This report also allows hot-link access to the individual Deployment Delivery Report for all deployments listed when you are logged into the portal.
This report is best exported as an Excel document for better reading and manipulation – do this by using the diskette icon dropdown in the navigation bar. You will also see in the header of the report an option to “Click Here to Download in CSV Format” within the report. This will dump the complete data for the selected deployments into one .csv file.
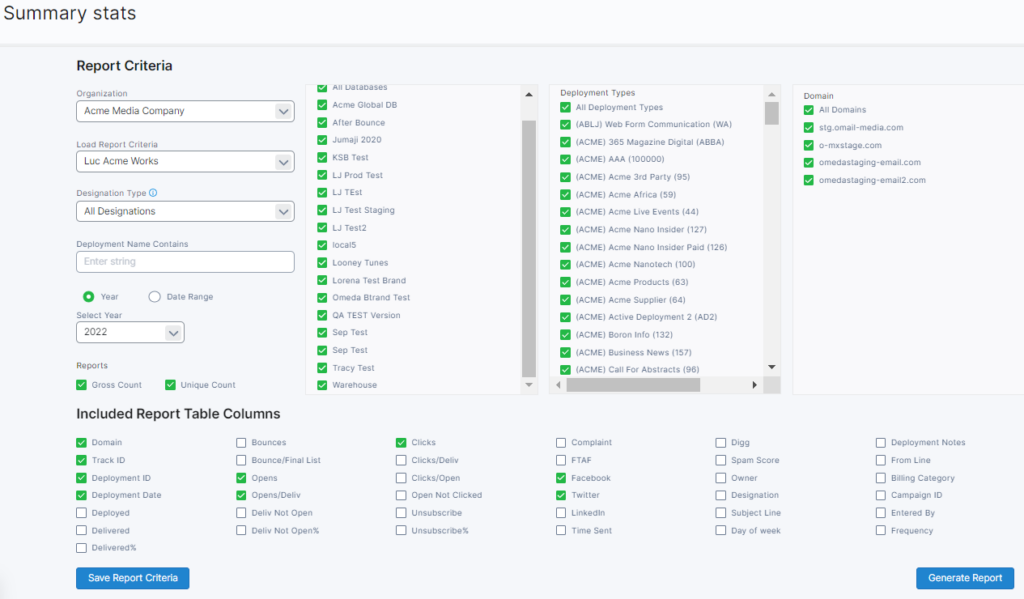
The table below details the different column header options for the Summary Stats report.
| On Default Report | Column Header | Description |
|---|---|---|
| Domain | Sending domain the email deployed from | |
| * | Track ID | Unique id for each deployment |
| * | Deployment Date | Date the email deployed |
| * | Deployed | The number of emails sent |
| * | Delivered | The number of emails accepted at the receiving server |
| * | Delivered% | Delivered/Deployed |
| * | Bounces | Includes both hard and soft bounces |
| Bounces/Final List | Bounces/Deployed | |
| * | Opens | Can be declared using unique and/or gross |
| * | Opens/Deliv | Opens/Delivered Can be declared using unique and/or gross |
| * | Deliv Not Open | Received by recipient and did not open |
| * | Deliv Not Open% | Delivered/Not opened |
| * | Clicks | Total number of clicks |
| * | Clicks/Deliv | Clicks/Delivered Can be declared using unique and/or gross |
| * | Clicks/Open | Clicks/Opens Can be declared using unique and/or gross |
| * | Open Not Clicked | Number of recipients that opened the email but did not click any link |
| Unsubscribe | Number of clicks on the Unsubscribe link using the standard merge variable PLUS the number of complaints | |
| Unsubscribe% | Unsubscribe/Delivered | |
| Complaint | The number of recipients clicking the 'this is spam' link in their email client | |
| FTAF | Number of clicks on the Omeda Forward to a Friend merge variable | |
| Number of clicks on the Omeda Facebook merge variable | ||
| Number of clicks on the Omeda Twitter merge variable | ||
| Number of clicks on the Omeda Twitter merge variable | ||
| * | Time Sent | What time the email deployed |
| Digg | Number of clicks on the Omeda Digg merge variable | |
| Spam Score | Metric generated when content is loaded using 3rd party product Spam Assassin | |
| * | Owner | This will default to the user who created the deployment or voyage but it can be overwritten at time of setup |
| Designation | Classification for the type of email | |
| * | Subject Line | The subject line of the email |
| * | Day of Week | The actual day of the week the email deployed |
| * | Deployment Notes | Auto-generated or user generated notes entered into the deployment |
| * | From Line | The actual 'from' line that appears in the email |
| Billing Category | Internal Omeda billing classification, a client specific option avaialable | |
| Campaign ID | The user entered text in the Campaign ID field | |
| Entered By | The user who created the deployment or voyage | |
| Frequency | Reads a setting in the database which declares the frequency of the send. This is an optional setting |
Within the Reports and Analytics tab, in the Email Reports section
Deployment Delivery Report
This will return you to the Email Builder search page to select the deployment for your report. See details of this report above.
Summary Stats Report
This will return you to the Summary Stats section, located within Email Builder. See details above.
Summary by Link Category and Summary by Link Category-Data
These reports are dependent on the categorization of URL’s within the deployment. Please review that process here. The report will provide delivery information by the category, category value and keyword which was assigned to a URL within the Tracking pleat in the Email Builder application. The report will list each deployment where the category/category value/keyword appears. The report provides the number deployed, delivered, opened, and clicked for the entire deployment. The Category Clicks and % shows the actual number of clicks for just the category/category value/keyword combination. The report is available in Gross or Unique numbers. The -Data version of the report provides one spreadsheet of data as opposed to different sheets for each category.
Summary by Link Category
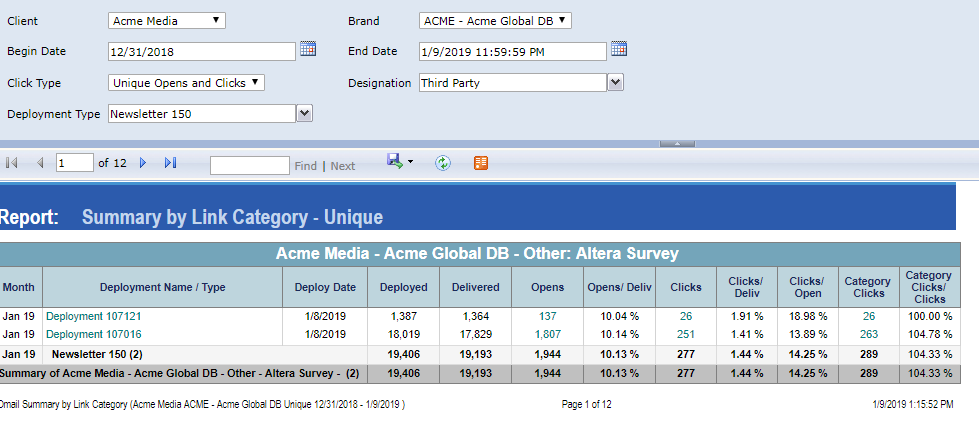
Summary by Link Category-Data

Audience Delivery Report
This report will show each email address in the audience list and the final disposition or the action(s) taken. You will see if the email address was filtered, suppressed, deduped prior to sending. The actions taken by the recipient are then also listed – bounced, opened, clicked and unsubscribed. Additionally, you will have columns that show the date/time for each of the following: Delivered, Bounced, Opened, Clicked, Unsubscribed and Complaint

Campaign Leads
This report is dependent on the categorization of URL’s within the deployment. Please review that process here. This report is similar to the Summary by Link Category but provides more filter options to select, an option to output a variety of formats for the actual recipients that clicked, and a printable format for the advertiser/user of the report. This report will roll-up the counts on the Category and Category Value description per the data you enter in the filter options. You can also select from 3 different galley formats to obtain a report of the recipients that did click.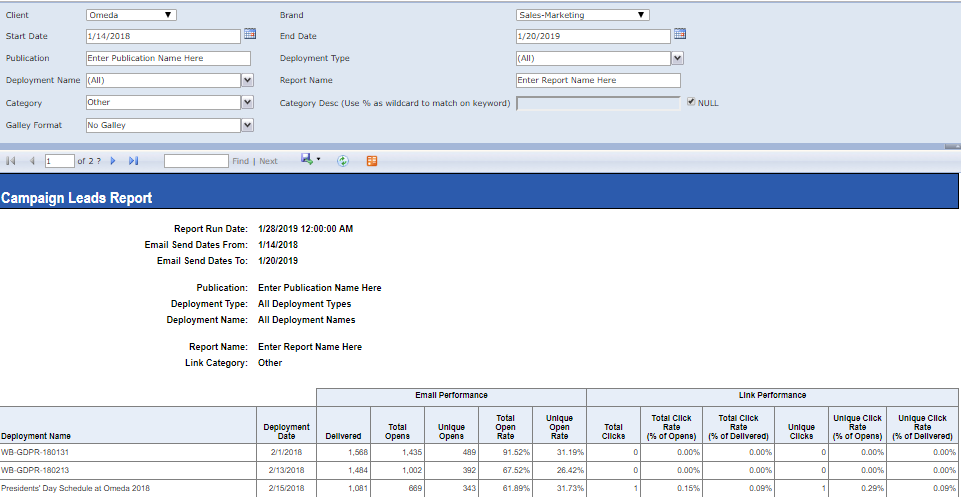
URL Click Report
This report will show complete data about the recipients that clicked on each link. The criteria filter for running the report can be as finite or as broad as needed.
The Detail Type selection criteria can be a true time-saver. It offers you two options:
- Detail: each individual click with the click date and time will be listed
- Summary: a roll-up by URL with an added column for the number of clicks/URL. The date/time of the click will be from the first click.
The report will provide the complete contact information from the audience list and each URL that was clicked along with the date and time of the click.

Popular Links Tracked
This report will identify the most clicked links within your specified time-frame. First, enter your desired start and end dates. You can then also refine your selection by sending domain and/or specific deployment types. The final criteria for selection is the order by the Unique or Gross click counts and then set the parameter for how many URL’s should be displayed in the report.
Once you click ‘View Report’, the top URL’s will be displayed with columns of data for the number of deployments where the link occurred, the Unique click count and the Gross click count. The column for # of times used should be factored into the total number of clicks that is reported.
This report can be exported as an Excel document.
This report can be very valuable to the editorial team when determining the types of content which generated the most clicks.

Clickbot Summary Report
This report will provide top level statistics on the overall number of clicks that were counted and also those that were negated due to the automated click activity that occurs at the receiving servers.
Simply narrow down the selection criteria that you desire by specifying date ranges, sending domains, deployment types, designation and also deployment type ID’s.

Once you click ‘View Report’, each deployment will be displayed.
- Final List Qty, Unique Opens, Gross Opens, Unique Clicks and Gross Clicks – these numbers mimic the deployment delivery report statistics.
- All Click Activity – This is the sum total of all clicks that occurred
- Total Clicks Negated – this is the number negated due to either the inherent rule sets that Omeda implements or due to the presence of a stealth link
This report can be exported as an Excel document.

Clickbot Summary – Report Columns
| Report Header | Explanation |
|---|---|
| Track ID | ID of the Email Send |
| Split # | # of Splits in Deployment |
| Deployment Type | Deployment Type Name |
| Domain | Sending Domain |
| Sent Date | Date of Deployment |
| Deployment Name | Email Name |
| Final List Qty | Total List Size |
| Unique Opens | Unique Open Count |
| Gross Opens | Total Open Count |
| Unique Clicks | Unique Click Count |
| Gross Clicks | Total Open Count |
| All Click Activity | All Clicks |
| Total Clicks Negated | Clicks Negated due to Bot Activity |
| % of Clicks Negated | Total Clicks Negated / All Click Activity |
Clickbot Detail

This report will provide the details of all click activity and what was ultimately counted and negated. It allows you to enter up to 10 TrackID’s.

The Is Real column denotes if the click was counted or not
- 0 – the click was not counted/not real
- 1 – the click was counted/real
By examining the Click Date field, you can find the interval of the click activity which is one of the factors that is used to either count or negate click activity.
Source IP is where the click originated. We have found that Barracuda (a security product used at many corporate domains), will many times click on the first URL and no other URL’s in a deployment as part of their methodology. If you see an abundance of clicks with the Source IP = 209.222.8x.xxx, you can safely assume that those are false clicks.
The Reason and Fake Click Trigger Value field shows the reasons why the click was not counted.
This report can be exported as an Excel document to allow further filtering and analysis.
Clickbot Detail – Report Columns
| Report Header | Field Explanation |
|---|---|
| Track ID | ID of the Email Send |
| Link ID | ID of Link In Email Builder |
| Click Date | Date Click Occurred |
| Is Real | Indicates Real Click (Not Bot-generated) |
| Link Url | URL of Link Clicked |
| Email Address | Recipient Email |
| User Agent | String capturing OS/Browser/Version of Click Generating Entity |
| Source IP | IP address of Click-generating entity |
| Reason | Fake Click Trigger Internal ID |
| Fake Click Trigger Value | Friendly Description for Fake Click Trigger Reason |
Legend: Reason Codes
| Reason code | Reason Code Description |
|---|---|
| 1 | Two clicks within 2000 milliseconds (2 seconds) |
| 2 | More than 10 clicks within 30 seconds |
| 3 | Percentage of fake clicks exceeds 50% |
| 4 | Number of unique source IP address exceeds 12 |
| 5 | Total number of clicks received exceeds 200 |
| 6 | Number of unique user agents exceeds 9 |
| 7 | User agent of click is within pre-defined list |
| 8 | Source IP address of click is within list {tracking.agent_ip_range_ignore_list} |
| 9 | Source IP address of click is within pre-defined list |
| 10 | Link was clicked 5 seconds after send |
Opt In_Out Count by Deployment Type
NOTE: This report is for internal users only to balance data at conversion. Clients can work with their Client Success Manager if this data is needed. This report provides a snapshot of current general record counts for all available Newsletter and Deployment Type Opt-Ins and Opt-Outs. Use this report to view high-level counts for Opt-Ins and Outs in a single place at a given time.

Note: These numbers will not match standard newsletter product queries 100% because it does not take into account:
- The contact rules for included newsletters
- Email validity
Total Emails Sent
This report is based on individual email addresses (not customers) and will show the total # of emails received for each email address for the date(s) that you select to run the report. Simply narrow down the selection criteria that you desire by specifying date ranges, sending domains, deployment types, and designation.

Once you click ‘View Report’ a 2-column report will generate showing the # of emails in ascending order and the # of people who received that many emails:
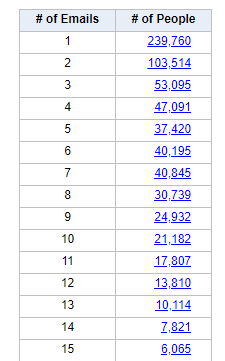
Clicking on the # of people will open an additional tab that displays: – Email Address – Tracking # for each email sent to that email address – Total Deployment Types sent to that email address
Both the list and the details can be exported to Excel for additional sorting/sharing.
Delivery by Receiving Domain
This report provides delivery statistics to analyze how the receiving servers are accepting the email from each sending domain. The primary use case of this report is to compare the open rates across the different receiving domains to review for deliverability and possible spam foldering of the emails. It is important to view the Open Rate across domains – a low open would indicate that the email was delivered to the spam folder. The user can filter the data by using a date range, choosing sending domain or IP. There is the ability to limit the results to just the top receiving domains, or limit to as many as 500 domains. If your date range contains no more than 31 days, you can also select to view the data on a day by day basis. The user can even choose to turn Clickbot Activity on or off in the report. Due to the large quantity of data in this report, it should be exported into Excel for better viewability
Deployment External URL
This report will provide a functional URL for each email that was sent to allow you to maintain your own internal library of ‘past issues’ of newsletters and such.
Deployment Sync and Link Sync reports
The Deployment Sync report provides data on the top level statistics for each send. The Link Sync report provides the click activity on each URL in addition to the Category/Category Value/Keyword. The Link Sync report also allows you to select either the Full or Abbreviated URL. Used in conjunction with each other, this data can feed any type of internal reporting at our clients. These can also be easily automated to be run at set frequencies and placed on the clients sftp site. This data is best produced when there is an offset period – i.e. produce a report from deployments sent 7 days ago. This allows you to get the complete open and click activity.
Newsletter Campaign
This report is dependent on the categorization of URL’s within the deployment as ‘advertising’. Please review that process here. The report will provide the overall Open Rate and then the Click activity for each URL with Category=Advertising. Each combination of Category/Category Value and URL are shown on separate pages. Along with the actual click numbers on the URL, a list of “soft leads” is provided – the name, title, company and email address of the person that clicked.
Email Leads
This report is dependent on the categorization of URL’s within the deployment. Please review that process here. Using the available filters, you can ultimately receive a report of the overall email performance and then link performance based on a combination of category/category value/keyword. If available, the report can also scrape in an image from the URL.